Curated OER
Graphing
In this graphing worksheet, students solve and graph 10 different problems that include determining various coordinates and the slope. First, they use the table to write the x and y coordinates for each point on the graphs. Then,...
Curated OER
Introduction to Graphing
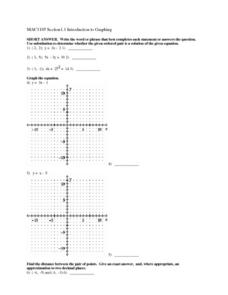
In this graphing worksheet, students graph linear equations on a coordinate plane. Students identify the slope and y-intercept of each problem, find the midpoint of a line, and the distance between given points. Given an equation,...
Curated OER
Building Understanding of Rate of Change/Slopes Using Alice
Students explore slope as a rate of change. In this eighth grade mathematics lesson plan, students investigate real-world problems to determine rate of change and transform it into a linear representation, thus determining slope....
Curated OER
Math Mediator Lesson 10: Slope
Students explore the concept of slope. In this Algebra I instructional activity, students investigate the definition of slope as rise over run or change in y compared to change in x. The instructional activity includes a real-world...
Flipped Math
Equations of Lines in the Coordinate Plane
What, you mean there is algebra in a Geometry class? Pupils review graphing and writing the equations of lines in slope-intercept form. The instruction follows the "I do, we do, you do" framework of a lesson. The instructor first...
Curated OER
Write the equation of a line, given slope and a point
Young mathematicians write equations of lines in this algebra lesson. They solve linear equations into the slope intercept form. Next, they graph the lines using the slope and the y-intercept, and they write equations for the lines using...
Math-U-See
Extra Practice
From exponents to slope-intercept form, an array of extra practice exercises will reinforce necessary skills for your middle and high schoolers. The worksheets include practice with order of operations, graphing equations, scientific...
Curated OER
What Functions do Two Graph Points Determine?
Your algebra learners write linear, exponential, and quadratic equations containing the same two graph points in this collaborative task.
Shodor Education Foundation
Linear Inequalities
An interactive lesson helps individuals learn to graph inequalities in two variables. Scholars can adjust the interactive to present the inequalities in standard or slope-intercept form.
Curated OER
Equations: Graphs, Lines, Slope
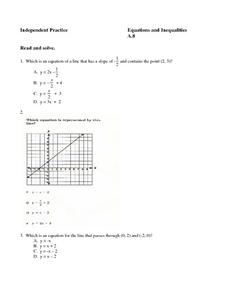
In this equations worksheet, students complete 8 multiple choice questions regarding writing equations in slope-intercept and matching an equation to its graph in the coordinate plane.
Curated OER
Do Two Points Always Determine a Linear Function II?
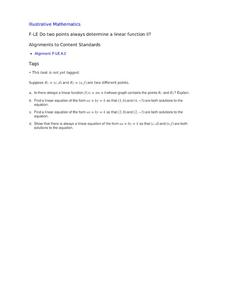
Learners analyze the difference between the slope intercept and standard forms of a line in this task. Given two general points using letters they explore linear functions and linear equations.
West Contra Costa Unified School District
Multiple Representations of Equations
class members first work through finding the equation, table of values, graph, and key features of a linear function expressed verbally. Individuals then work through several more problems given different representations.
Curated OER
Graphing Linear Equations and Inequalities
Students discuss methods to solve equations and inequalities with one variable. As a review, they write Addition and Subtraction properties of equality and Multiplication and Division properties of equality. Students graph points, write...
Mt. San Antonio Collage
Test 1: Graphing Functions
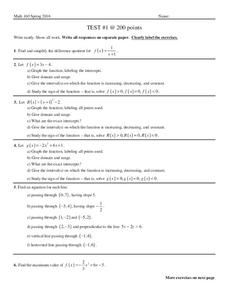
Graph the night away with all the different types of functions provided in the worksheet. Linear, quadratic, and rational all ask for graphs, domain and range and other key factors about the functions.
Curated OER
The Slope of a Line
Students define the slope of a line as rate of change. They investigate positive, negative, zero, or undefined slope using a graphing calculator. They determine the slope of a line when given the equation of the line.
Curated OER
Slopes of Lines
In this slopes of lines instructional activity, 10th graders solve and graph 10 different problems. First, they determine the slope of each line named in the figure and any line parallel to line b and perpendicular to line d. Then,...
Curated OER
Solving Linear Systems by Graphing
A activity that offers four problems to practice solving simultaneous equations by graphing. Equations are presented in slope-intercept form or standard form. Problems include two with unique solutions, one with no solution, and one with...
Curated OER
Graphing Lines
In this graphing lines worksheet, students graph lines that are in the point-slope form. They identify the y-intercept and the slope. They graph the equation of a line on a coordinate plane. This four-page worksheet contains 12...
Curated OER
Basic Algebra and Computers: Spreadsheets, Charts, and Simple Line Graphs
Students, while in the computer lab, assess how to use Microsoft Excel as a "graphing calculator." They view visual representations of line graphs in a Cartesian plane while incorporating basic skills for using Excel productively.
Curated OER
Algebra I - Worksheet G12: Graphing Lines
In this graphing lines worksheet, high schoolers graph 28 lines given various data. Students graph lines given two points, a point and slope, and a line perpendicular or parallel to a point.
Curated OER
Chapter 7. Functions and Graphs
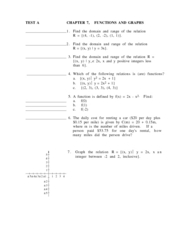
In this functions and graphs instructional activity, students determine the domain and range of a given relation. They graph functions on a coordinate plane and write equations in the slope-intercept form. This twelve page...
BW Walch
Solving Systems of Linear Equations
Solving systems of equations underpins much of advanced algebra, especially linear algebra. Developing an intuition for the kinds and descriptions of solutions is key for success in those later courses. This intuition is exactly what...
Curated OER
US Airports, Assessment Variation
Determining relationships is all part of algebra and functions. Your mathematicians will decide the type of relationship between airports and population and translate what the slope and y-intercept represent. The problem is multiple...
CK-12 Foundation
Graphs in the Coordinate Plane: Functions on a Cartesian Plane
Connect the dots to graph a linear function. Young mathematicians use an interactive to first plot provided points on a coordinate plane. They connect these points with a line and then answer questions about the slope and y-intercept of...


