Curated OER
Inquiry Unit: Modeling Maximums and Minimums
Young mathematicians explore the maximun area for patio with the added complexity of finding the mimimum cost for construction. First, they maximize the area of a yard given a limited amount of fence and plot width v. area on a scatter...
Curriculum Corner
7th Grade Math "I Can" Statement Posters
Translate the Common Core math standards into a series of achievable "I can" statements with this collection of classroom displays. Offering posters for each standard, this resource is a great way to support your seventh graders as they...
Curriculum Corner
7th Grade Math Common Core Checklist
With so many math standards to fit into a school year, it can be difficult keeping track of what you have and have not covered. This collection of Common Core checklists allows you to maintain a running record of when each standard was...
Curated OER
Best Practices of Technology Integration
Students participate in a lesson in order to practice using systems of equations in order to graph them. A cumulative project in the form of a brochure, web page, or interactive kiosk make this lesson more engaging.
Curated OER
How Many Solutions 2
Students solve systems of equations. In this algebra activity, students graph lines and identify the point of intersection. They identify the function to see if it is a function.
Curated OER
Cramer's Rule ID: 8793
Mathematicians are introduced to Cramer’s Rule and use it to solve three systems that have one solution, no solutions, and an infinite number of solutions. Students use TI-Nspire to graph the systems to verify their answers and...
Curated OER
Pancakes, Anyone?
First graders explore data collecting and graphing. In this data collecting and graping lesson, 1st graders watch a video about monster who sells pancakes. Students make a graph to record the most popular pancake. Students also play...
Michigan Sea Grant
Water Quantity
It may be tricky for a young mind to conceptualize that less than 1% of all water on earth is useable for humans to drink. Simulating the amount of fresh water available on earth by removing measured amounts of water from a five-gallon...
Curated OER
Giving it 100%
Students build knowledge about the number relationships between decimals and percents as it relates to converting decimals into percents. In this decimal and percent instructional activity, students recognize equivalent forms of...
Curated OER
Introduction to Radiation Shielding
In this radiation shielding activity, learners use a graph of the dosage of radiation versus the thickness of aluminum shielding using data from the MIR spacecraft and ISO satellite to solve 3 problems. They determine how thick the walls...
Curated OER
A Child's Journey through Medicine
Students experience a variety of activities that relate to human physiology and their functions. They create graphs and charts after testing their heart rates and blood pressure They conduct a survey of the student body and create ...
Curated OER
Equations of Lines Perpendicular and Parallel
In this algebra worksheet, students solve linear equations using one and two steps. They solve systems of equations using substitution and elimination with graphing. There are links for ready made tests and quizzes.
Virginia Department of Education
The Exercise Fields
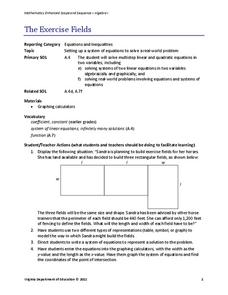
Horses need exercise, too. Scholars create linear equations to model the perimeter of exercise fields for horses. They finish by solving their equations for the length and width of the fields.
Virginia Department of Education
How Much is that Tune?
Tune in for savings! Scholars investigate pricing schemes for two different online music download sites. After comparing the two, they determine the numbers of songs for which each site would be cheaper.
GeoGebra
All For One, One For All
Will someone please constrain those pets? Pupils create two constraint equations on the number of cats and dogs for a pet sitter. They choose specific points and determine whether the point satisfies one or both constraints. The...
UAF Geophysical Institute
Carbon Footprint
Your young environmentalists can calculate their carbon footprint and discuss ways to reduce it with a worksheet about climate change. After reading a handout about what impact one's carbon footprint can have on the environment, kids...
Mathematics Assessment Project
College and Career Readiness Mathematics Test C1
Challenge high schoolers with a thorough math resource. The 20-page test incorporates questions from upper-level high school math in applied and higher order questions.
American Statistical Association
Happy Birthday to . . . Two?
How many people do you need in a room before two likely share the same birthday? Scholars consider this puzzle by analyzing a set of data. They ponder how to divide the data and determine the proper size of a group for this event to...
Curated OER
Choosing a Summer Job
What did you do over your summer vacation. Young wage earners must compare summer job options, and determine when each job earn the same amount and what that amount be. This be done by creating, graphing, and solving systems of...
Curated OER
Jelly Belly: What a Wonderful "Bean"!
Students explore how jelly beans are produced. They discuss the origins of the jelly bean and view a video about how jelly beans are prepared, tested, shaped, finished, and shipped and estimate the amount of jelly beans in a jar and sort...
Curated OER
Using the Very, Very Simple Climate Model in the Classroom
Students study the relationship between the average global temperature and carbon dioxide emissions. In this weather lesson students develop a test scenario using a model then read and interpret graphs of data.
Curated OER
Unit 2 Sun & Stars
Students describe stellar objects using terms such as stars, planets, satellites, orbits and light. In this sun and stars unit, students research stellar objects through seven individual lessons discovering star characteristics, how...
Curated OER
Slope Calculation
Students compute the slope of a line based on the coordinates of two points on the line. In addition, they examine the relationship between the numerical value of slope and its properties on a graph.
Curated OER
The Swinging Pendulum
Students observe a pendulum and graph their observation. In this algebra lesson, students use the TI calcualtor to graph the motion the pendulum makes. They analyze the graph and make predictions.


