Curated OER
A Study of a Quadratic Function
Young scholars factor and solve quadratic equations. In this algebra lesson, students play a game as the collect and graph data. they identify properties of their parabola and make predictions.
Curated OER
Playing With Probability
Students rotate through work stations where they compute problems of theoretical and experimental probability. In this probability lesson plan, students use simulations of a lottery system.
Curated OER
They Don't Just Eat Grass
Middle schoolers explore and examine different types of feed used for livestock. They discuss types of feed, the need for energy and health, and create graphs of food compared to categories. Students organize data and complete worksheets...
Curated OER
Tree Identification
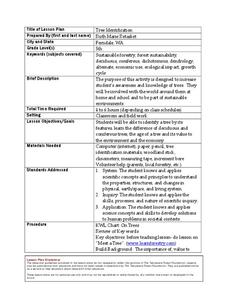
Students list four ways to identify trees. In this tree identification instructional activity, students use tree identification techniques such as leafs, bark, wood grain, soil type, and climate to create tables and graphs.
Curated OER
FOOTSTEPS IN TIME
Students measure and correlate their foot lengths and body heights, then use this data to estimate height of Laetoli hominids. They use metric measurement and graphing to determine these heights.
Curated OER
Leap Into Exponential Functions
Students use properties of exponents to solve equations. In this algebra lesson, students add, subtract, multiply and divide exponential functions. They graph and differentiate between exponential growth and decay.
Curated OER
Introduction to Measurement
Young scholars are able to observe and measure the variability in the length of the forearm and the length of the foot and to test a common belief of the foot is equal to the length of the forearm.
Pennsylvania Department of Education
Freckle Face
Students collect and record data. In this early data analysis lesson, students gather data about their partners face. As a class, the students use tally marks and pictographs to record the data and answer question about the information...
Pennsylvania Department of Education
Alike and Different
Students compare and contrast objects and are introduced to a Venn Diagram. In this alike and different instructional activity, students make observations regarding properties of objects. Students classify object and build ideas about...
Curated OER
Newton's Third Law and Aircraft Propulsion
Learners research propulsion, graph data, and interpret the results.
Curated OER
The Dead Zone: A Marine Horror Story
Students graph dissolved oxygen versus depth using data taken from NECOP Program. In this marine science lesson, students explain the causes of hypoxia. They recommend possible solutions to this problem.
Curated OER
Does the falling tree make a sound if no one if there to hear it? (or communication via encryption)
Students explore encryption. They discuss the importance of cryptography in our daily lives. Students use games and cryptography to discover transformational geometry and modulo systems. They design their own encryption puzzles and...
Curated OER
Square Milk Bottle Crates
Learners attempt a problem that Students has the potential to have more than one solution. Hence the problem is accessible to a wide range of learners. The problem is essentially about finding patterns and this is typical of a number of...
Curated OER
The Air Up There!
Students create a model of a column of air and discover one of the reasons why low and high pressure systems exist and why low pressure is often associated with bad weather.
Curated OER
Matter
Students complete a unit of activities to learn about states of matter and how to measure matter. In this matter activity, students complete 8 lessons to learn about matter, its states, and how to measure matter.
Discovery Education
Sonar & Echolocation
A well-designed, comprehensive, and attractive slide show supports direct instruction on how sonar and echolocation work. Contained within the slides are links to interactive websites and instructions for using apps on a mobile device to...
EngageNY
Complex Numbers and Transformations
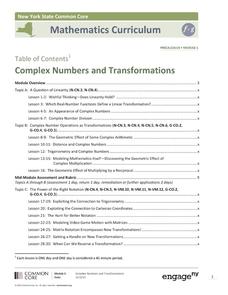
Your learners combine their knowledge of real and imaginary numbers and matrices in an activity containing thirty lessons, two assessments (mid-module and end module), and their corresponding rubrics. Centered on complex numbers and...
Achieve
Ivy Smith Grows Up
Babies grow at an incredible rate! Demonstrate how to model growth using a linear function. Learners build the function from two data points, and then use the function to make predictions.
Noyce Foundation
Parallelogram
Parallelograms are pairs of triangles all the way around. Pupils measure to determine the area and perimeter of a parallelogram. They then find the area of the tirangles formed by drawing a diagonal of the parallelogram and compare their...
Curated OER
Cross Cultural Transportation and Resources Exchange
Students examine various modes of transportation. They explore regional transportation options and discover options available in their area. Students survey types of transportation people use in their area. Using spreadsheet data,...
Curated OER
Solving the Puzzle
Students create a map showing the United States borders at a specific period in history and produce three questions to be answered by examining the map. They also write a productive paragraph explaining who, what, when, where, how/why a...
Intel
Play Ball!
Math and sports meet on the baseball diamond in the first STEM lesson in a series of six that asks pupils to collect and perform comparative analyses of data specific to baseball. Following the analysis, scholars create a presentation...
Curated OER
Conjectures and Conclusions
Students draw conclusions and make conjectures given a specific scenario. In this geometry lesson, students model real life scenarios using properties of triangles. They model number facts and explain why the outcome is what it is.
Curated OER
Optimization For Breakfast
Students identify he proportion of a cereal box. In this algebra lesson, students define the relationship between patterns, functions and relations. They model their understanding using the cereal box.


