Curated OER
Exploring the Variety of World Markets
Students examine the various types of world markets and analyze the differences between developed and developing countries. They watch a PowerPoint presentation and take notes, participate in a role-play that demonstrates supply and...
Curated OER
Determining the Age of Fossils
Students examine the concept of radioactive dating. In this radioactive dating lesson, students investigate how to determine the ages of fossils and rocks as they learn about half-life radioactive decay.
Curated OER
Heathly Foods Makes Heathly Body
Students examine and identify foods on the food pyramid. They catergorize food and place them on the correct level. They discover why they should eat foods in moderation.
Curated OER
Inch by Inch and Centimeter by Centimeter Extravaganza
Students use both standard and metric measurement. They compare and contrast standard to non-standard units of measurement.
Curated OER
Line of Best Fit
Students identify the line of best fit. For this statistics lesson, students collect and analyze data. They calculate the regression equations and identify the different types of correlation.
Curated OER
Jack-O-Lantern Glyph
Students create a jack-o-lantern glyph that accurately represents his or her answers to a series of questions. The completed jack-o-lanterns are displayed in the classroom and the class interprets the data.
Curated OER
Which Color Will You Pick?
Young scholars create a spreadsheet to chart the different colors found in a package of M&M's or Skittles. They collect data, create appropriate charts, and use percentages to describe quantities.
Curated OER
Divided We Stand
Learners figure out how to arrange seating in a concert hall given specific requirements. They better explain how dividing can allow us to arrive at mathematical solutions quickly and logically.
Curated OER
Plotting Amish Farmland
Second graders listen to the book, Down Buttermilk Lane by Barbara Mitchell. They discover how to read a grid and then together as a class, plot 2 squares, one yellow and one green. Then they plot the remaining squares independently and...
Curated OER
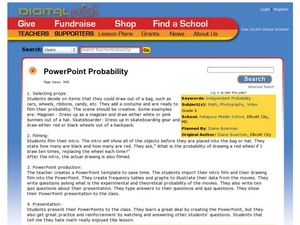
PowerPoint Probability
Sixth graders investigate film making by creating a video about probability. In this math visualization lesson, 6th graders create a presentation for their class demonstrating the probability of random events taking place in the real...
Science Education Resource Center at Carleton College
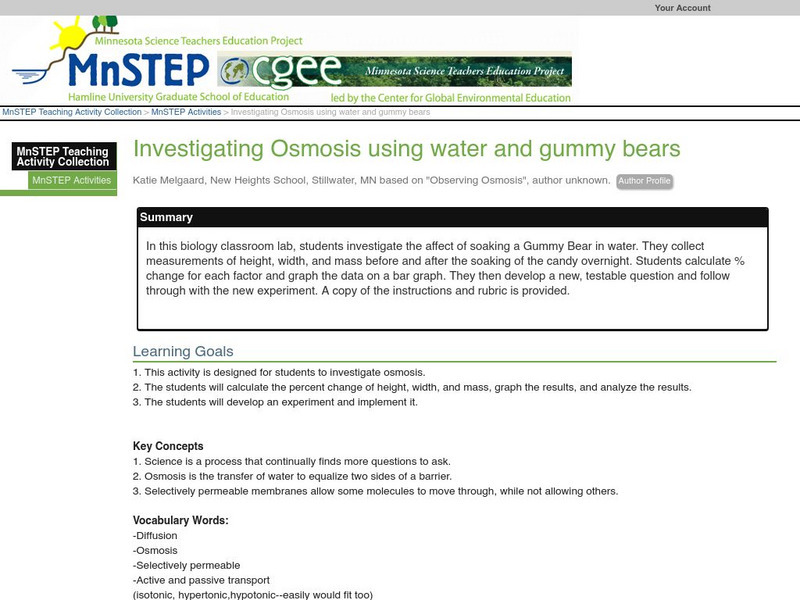
Serc: Investigating Osmosis Using Water and Gummy Bears
For this biology classroom lab, students investigate the affect of soaking a Gummy Bear in water. They collect measurements of height, width, and mass before and after the soaking of the candy overnight. Students calculate % change for...


