Curated OER
Modeling Drug Assimilation in the Human Body
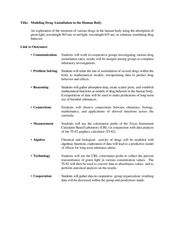
Students investigate the accumulation of drugs in the body. In this algebra lesson, students collect data on drug retention and assimilation. They use their data to predict the behavior and effects of drugs.
Curated OER
Pints and Quarts
For this measurement worksheet, students study the sets of pints or quarts for the 7 problems. Students circle the set of measurements that are less.
Curated OER
The Nesting Habits of Folders
Students create an organized web of nested grade level folers. Within each grade level folder, they create a Language Arts/Social Studies folder and a Math/Science folder. All folders be color coded.
Curated OER
Researching Stocks on New York Stock Exchange
Sixth graders research to find background information and stock history over the last year about a company listed on the NYSE. They evaluate whether or not they should "invest" in that company. They write a persuasive essay outlining...
Curated OER
Flying Geese
Students examine the Flying Geese quilt pattern, and discuss and identify the pattern. They write a paragraph titled, My Quilt Report, summarizing the information discussed about the quilt patterns.
Curated OER
Absolute Value Equations and Inequalities
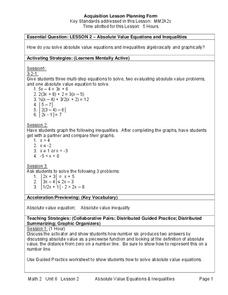
Students explore the concept of absolute value inequalities and equations. In this absolute value inequalities and equations lesson, students discuss how to solve absolute value inequalities and equations through teacher led discussion...
Curated OER
Graphing Grazy Crayons
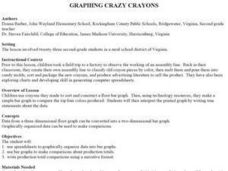
Children create crazy crayons they made to sort and construct a floor bar graph. Then, using technology resources, they make a simple bar graph to compare the top four colors produced. Students will then interpret the printed graph by...
Curated OER
Heads-Up Probability
Second graders use tree diagrams to predict the possible outcomes of coin tosses. The data they collect and graph also help them predict the likelihood of getting heads or tails when tossing coins the next time.
Curated OER
Asian Americans: Where Do They Come From?
Young scholars identify 15 places (14 countries plus Hawaii) from which large populations of Asian Americans originate. They create a graph to help themselves visualize the places from which large populations of Asian Americans...
Curated OER
Water Survey
Students investigate water usage for the average home with the help of conducting a home survey. The information is collected and organized into a graphic format. Then they analyze the results to formulate an educated opinion about water...
Curated OER
Solving Percent Problems with Proportions
Seventh graders explore the concept of percent problems. In this percent problem instructional activity, 7th graders use proportion equations to solve percent problems. Students find percentages of numbers and use proportions to...
Curated OER
Chart Trivia
Learners practice addition and subtraction problems and answer questions using greater than and less than. They chart information to create a graph on the computer.
Curated OER
Inching Our Way Into The Metric System
Students investigate the Metric System. They discuss the history of the Metric System, convert various units of measurement into the Metric System, and solve problems on a spreadsheet.
Curated OER
Accounting -- Financial Career Brochure
High schoolers review career brochures for schools & colleges and Use the Internet to explore an accounting related career. They plan their own brochure using the Career Brochure Planning Storyboard.
Curated OER
Introduction to Scatter Plots and Correlation
Students examine the concept of scatter plots. They compare baseball statistics to locate the ones that correlate with winning, and identify the positive, negative, and no correlation in sets of data using MS Excel.
Curated OER
Going with the Flow
Learners survey each other and determine their common interests. They examine the use of algorithms by various websites that are used to develop networks of interest groups among users. They then design proposals for a social networking...
Curated OER
Virtual Field Trip / Route, Mileage and Gasoline Cost Graphs
Students use a spreadsheet program to graph and compare milage, gasoline costs and travel time for two travel routes in their virtual field trip in Michigan. They determine the most economical route based on the graphs and calculations.
Curated OER
Doing More In Less
Students watch segments of a NASA program called "Doing More In Less". In groups, they examine the concept of human exploration and how NASA has contributed to specific research. They are introduced to new vocabulary and answer...
Curated OER
UN-derstanding the United Nations
Use these interesting facts as a springboard for a culturally and globally diverse classroom discussion on the United Nations.
Curated OER
Ecosystems-The Essential Connection
Students develop their abilities to solve problems both in school and in a variety of situations similar to that they have encountered in life. They define the term ecosystem in nature by comparing them to familiar organizational...
Curated OER
Nellie Bly's Newspaper Club: Introducing the Science of Writing
Students evaluate a video about Nellie Bly, a famous reporter from the 19th century. They consider what makes a high-interest news article, write an essay in pairs and present it a literary tea.
Curated OER
Sequencing Events
Using The Very Hungry Caterpillar by Eric Carle, pupils practice sequencing events in a story. After reading the story, they head to the computer lab to use Kidspiration to sequence events. Then they create their own books to demonstrate...
Curated OER
The Animals
Fourth graders participate in a virtual field trip to the San Diego Zoo and complete various computer lab excercises to expand their understanding.
Curated OER
Shared and Guided Reading with Ice Cream Money
Here is a lesson plan which has young scholars locate an exclamation point and a comma from the text. They locate previously learned words on the page, and create a word map from the word "Money." Students write about and illustrate...


