Curated OER
Integer Addition
Seventh graders explore the concept of integer addition. In this integer addition lesson, 7th graders tell stories involving addition and subtraction. Students walk on a number line given directions such as add 3 or add -2. Students play...
Learning Express
501 Writing Prompts
Never again will you need to worry about coming up with a writing prompt! This packet contains, as it says, 501 prompts that are suitable for fourth graders on up. The prompts are paired into four categories (persuasive, expository,...
Curated OER
Scholarship and Learning in Islam
Students explain what a madrasah represents in Islam. Using the Muslim world as an example, they identify and describe two or more centers of learning. They explain the contributions that Muslims have made to science and math and...
Curated OER
Introduction to Graphical Representation of Data Sets in Connection with Nuclear Decay
Students record data, make observations, and share in experimentation and discussion of numerical experiments.
Curated OER
Doing More In Less
Students watch segments of a NASA program called "Doing More In Less". In groups, they examine the concept of human exploration and how NASA has contributed to specific research. They are introduced to new vocabulary and answer...
Curated OER
Graphic Favorite Breakfast Foods
Second graders graph data based on a class survey of their favorite breakfast foods. In this graphing lesson plan, 2nd graders take a class survey of their favorite breakfast foods. Then they take that data and put it into a computer...
Virginia Department of Education
Translate and Evaluate
Translate, evaluate, educate. Discover how to translate and evaluate expressions. Young mathematicians first review words and phrases that indicate operations and learn to write algebraic expressions from verbal descriptions....
Virginia Department of Education
Analyzing and Interpreting Statistics
Use measures of variance to compare and analyze data sets. Pupils match histograms of data sets to their respective statistical measures. They then use calculated statistics to further analyze groups of data and use the results to make...
Curated OER
Asthma Survey
Students collect survey data on the prevalence of asthma in a community. They summarize and display the survey data in ways that show meaning.
Curated OER
CSI Rhino
Students study the rhinoceros and how the species has survived for so long. In this rhino lesson students create graphs and research what is being done to protect the rhino.
Curated OER
Santa's List Sums
In this finding sums worksheet, students complete a chart of "Santa's Sums" of boys and girls on various streets. Students add and record sums in last column of graphic organizer.
Curated OER
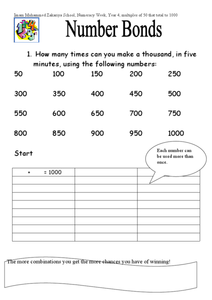
Combining Numbers to 1000
In this math worksheet, students look for the possible combinations to create number sentences that have a sum of 1000. They put the answer in the graphic organizer.
Curated OER
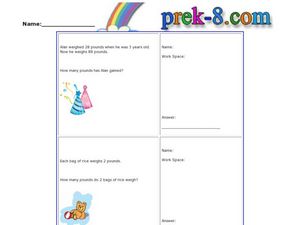
Practice With Word Problems: 2
For this word problem worksheet, students solve 2 problems arranged in a graphic organizer. The problem and related picture appear on the left, an answer line and work space on the right.
Curated OER
Practice With Word Problems
In this word problem worksheet, students solve 2 problems that are set up in a graphic organizer. The problem and related picture appear on the left, and a block of work space and answer line appear on the right.
Curated OER
Favorite Movies or Television Shows Survey
For this survey worksheet, students complete graphic organizer of survey information listing favorite movies or television shows, then answer 5 questions about the results of their survey.
Curated OER
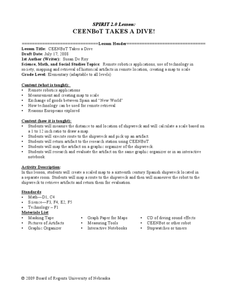
CEENBoT Takes a Dive
Students create a map to scale using technology. In this algebra lesson, students navigate through a shipwreck to perform rescues. They use he CEENBoT program to perform the different tasks.
Curated OER
Line Symmetry
Students investigate the concept of line symmetry and how to recognize it in different contexts. They record the number of symmetries when given problems to work on in class. They review the concept of congruence and how it relates to...
Curated OER
Zome System
Get hundreds of interactive activity plans using the Zome Modeling System. Among dozens of lessons, a first exposure to similar triangles can be very visual for the learner. Here, young geometers explore the number of different shapes...
Curated OER
KWL Chart
In this graphic organizer worksheet, students will use a chart to organize their information into 3 columns: what I know, want to learn, and what I learned.
Curated OER
Theorems and Formulas for Circles
In this theorems and formulas for circles worksheet, 10th graders solve and complete 13 different types of problems. First, they create a graphic organizer for all the given formulas for circles. Then, students use the labeled pictures...
Curated OER
Polygons
Fourth graders identify and describe lines, shapes, and solids using formal geometric language. They use Inspiration to create a graphic organizer and outline of polygons.
Curated OER
"Alphabet City and City by Number" by Stephen T. Johnson; "Shapes, Shapes, Shapes" by Tana Hoban
Students review the definition of angles by identifying those in the classroom and putting them on a graphic organizer.
Curated OER
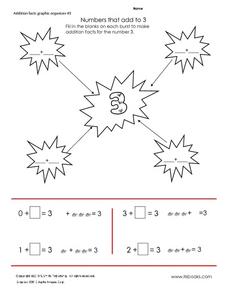
Numbers that Add to 3
In this addition facts learning exercise, students fill in the graphic organizer to make addition facts that equal the number 3, 4, 5, and 6. Students complete 8 facts for the 4 worksheets.
Curated OER
Perimeters, Patterns, and Conjectures
Students discover patterns and write conjectures relating to perimeters and polygons. Working in cooperative learning groups, they use manipulatives and graphic organizers to solve problems then answer a series of questions in which they...


