Curated OER
Virtual Field Trip
This hands-on resource has future trip planners analyze graphs of mileage, gasoline costs, and travel time on different routes. While this was originally designed for a problem-solving exercise using a Michigan map, it could be used as a...
Curated OER
"BATS on Parade" by Kathi Appelt
Students correctly express and interpret mathematical facts, concepts, and procedures in symbolic, verbal and graphical form. They use a table to organize information.
Curated OER
Wildlife, Wolves, Endangered Species
Students use the Internet to research wildlife and conservation efforts. They examine pictures and graphics to research endangered species and humans role in their lives. They also use math to measure areas of habitats and add the number...
Curated OER
Bioremediation
Young scholars design and conduct investigations that illustrate the effect bioremediation has on organic matter and determine environmental applications. They, in groups, present their findings to the class.
Curated OER
Exploring the Celestial Neighborhood
Ninth graders study the origin and organization of the solar system. They investigate the Earth's place in the system and how planetary motions explain natural phenomena observable from Earth.
Curated OER
Chart This!
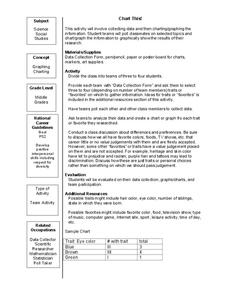
Students collect data and graph or chart the information. In this data organization lesson, students poll their classmates about certain topics and chart or graph the information to show the results of their research.
Curated OER
What Does Waste Do to a River?
Students develop a graphic way of visualizing the concept of a million by utilizing what had happened to the Nashua River due to the dumping of raw sewage in 1962.
Curated OER
Introduction to Scatter Plots and Correlation
Students examine the concept of scatter plots. They compare baseball statistics to locate the ones that correlate with winning, and identify the positive, negative, and no correlation in sets of data using MS Excel.
Curated OER
Virtual Field Trip / Route, Mileage and Gasoline Cost Graphs
Students use a spreadsheet program to graph and compare milage, gasoline costs and travel time for two travel routes in their virtual field trip in Michigan. They determine the most economical route based on the graphs and calculations.
Curated OER
Chances Are-Part 1
Students are introduced to the idea of probability by discussing the likelihood of events occurring. Pupils describe events that are certain, impossible, likely, and unlikely to occur. They determine the likelihood of an event occurring...
Curated OER
Butterfly Adventure
Students in second grade are paired with fifth grade computer research buddies. They observe the characteristics of caterpillars, and identify the four stages of the caterpillar to butterfly life cycle. They graph the number of...
Curated OER
Angle Exploration and Classification
Students compare and contrast angles and identify them as acute, obtuse, right, or straight angles. They create rays and angles using uncooked spaghetti, read and discuss key vocabulary terms, and complete a variety of geometry worksheets.
Curated OER
Predict and Infer
In this writing worksheet, students choose specific events from a story and predict what they think will happen next. They use the words and pictures to give them clues as to what might happen. Then, students write what really happened...
University of Georgia
Using Freezing-Point Depression to Find Molecular Weight
Explore the mathematical relationship between a solvent and solute. Learners use technology to measure the cooling patterns of a solvent with varying concentrations of solute. Through an analysis of the data, pupils realize that the...
Curated OER
The Seasonal Round and The Cycle of Life
Fourth graders are introduced to the concept of the seasonal round and how folklife traditions vary from season to season. They begin charting dates of personal interest on seasonal round calendars by starting with birthdays. Students...
Curated OER
Beyond The Earth Part I
Students explore the solar system. In this space science lesson, students take notes on the solar system provided by their instructors. Students then collaborate to design a computer-generated drawing of the solar system.
Curated OER
Analyzing Textbook Formats
Students explore the characteristics of a non-fiction text. In this comprehension lesson, students are led on a guided tour of each text and identify the features of a non-fiction text. Students continue to practice locating features...
Curated OER
Earth and Space Science: Exploring Earthquakes
Students explore earthquakes. In this earthquake lesson plan, students research earthquakes and identify where they take place. Students use map skills to track down earthquake locations. There are internet sites suggested in this lesson...
Curated OER
Vocabulary Charts
Students create their own vocabulary charts. They divide into groups and view an example of a vocabulary chart imbedded in this plan. Then, they create their own chart which is based on a particular subject area.
Curated OER
How Would You Spend a Million Dollars?
Students plan and organize a theme to spend one million dollars. They select a theme, research prices of items on the Internet, organize the information into a spreadsheet, write an introductory paragraph, and create a final project.
Curated OER
Exploring the Beach
Students explore the beach. In this marine habitat lesson, students inspect sand grains, design beach profiles, classify marine life, and examine natural beach habitats. Students use spreadsheets to record data from their activities at a...
Curated OER
Jalapeno Bagels
Students read the story Jalapeno Bagels and then write a summary about it. In this summary lesson plan, students retell the story as if someone else has not read the story.
Curated OER
Beyond the Earth Part II
Students explore the solar system. In this solar system lesson, students use Internet and print resources to research a component of the solar system. Students create travel brochures based on their research findings.


