Curated OER
What a Shape!
Second graders culminate their study of shapes by describing the shapes using the proper mathematical descriptors.
Curated OER
Off We Go
First graders identify different types of transportation, and explain why each is important. They pretend they are going on a trip. They choose their mode of transportation, and use play money to buy their tickets.
Curated OER
Gazebo Construction
Students create and give oral proposals for the construction of a gazebo using a blueprint created with Geometer's Sketchpad. They then build a gazebo model using the blueprints created and provide evidence why it should be selected for...
Curated OER
Traveling the USA
Students simulate the role of travel agents addressing the needs of a foreign family visiting a state in the US. They prepare a presentation and informational sales pitch of a proposed travel itinerary.
Curated OER
OTC Medications
Students sort medications by likeness and use. They compare and contrast using a Venn Diagram, and find the differences and commonalities of over the counter and Rx medications.
Curated OER
Be the Kiwi: New Zealand Introductory Activity
Students get a taste of New Zealand. In this global studies activity, students view photographs from the country and discuss its geographic location and features. Students then participate in a scavenger hunt based on facts about the...
Curated OER
Choosing a Summer Job
What did you do over your summer vacation. Young wage earners must compare summer job options, and determine when each job earn the same amount and what that amount be. This be done by creating, graphing, and solving systems of...
Curated OER
Aruba Cloud Cover Measured by Satellite
Students analyze cloud cover and to compose written conclusions to a given related scenario. They submit a letter of response and a report detailing their calculations and conclusions.
Curated OER
Student Costs Graph
Learners calculate the mileage, gasoline costs, and travel time and costs for a vacation. They conduct a virtual field trip, and create a comparison graph of costs using Microsoft Excel software.
Curated OER
The Nesting Habits of Folders
Students create an organized web of nested grade level folers. Within each grade level folder, they create a Language Arts/Social Studies folder and a Math/Science folder. All folders be color coded.
Curated OER
Pumpkin Writing Paper
In this writing worksheet, students use the blank lined paper with a colorful pumpkin border for any kind of writing: reports, poetry, stories or letters.
Curated OER
Where's the Barbecue?
Learners identify the major landforms, regions and rivers on a map of South Carolina. They compare the locations of the major Native American groups in the state as well. They chart where barbecue restaurants are located and write...
Curated OER
The Mighty Great Lakes and St. Lawrence Seaway System
Students participate in a variety of activities in a unit about the Great Lakes/St. Lawrence Seaway System. They create a diorama, read related stories, and correspond with other classes located in other port cities along the St Lawrence...
Curated OER
Back To School Crossword
In this reading worksheet, students analyze 10 words which pertain to Back to school time. Students read clues and fit the words in the crossword puzzle.
Curated OER
Flying Geese
Students examine the Flying Geese quilt pattern, and discuss and identify the pattern. They write a paragraph titled, My Quilt Report, summarizing the information discussed about the quilt patterns.
Curated OER
Graphing Grazy Crayons
Children create crazy crayons they made to sort and construct a floor bar graph. Then, using technology resources, they make a simple bar graph to compare the top four colors produced. Students will then interpret the printed graph by...
Curated OER
Self Portrait, What Nerve!
Students conduct an experiment to determine the distance between touch receptor fields in parts of the right-hand side of the body. They enter data into the data table.
Curated OER
Circle the Earth - Explore Surface Types on a Journey around Earth
Learners use CERES percent coverage surface data with a world map in locating landmasses and bodies of water at Earth's Equator.
Curated OER
Graph Both Crusts
Fourth graders calculate the angles and construct a pie graph of the percentages of the elements in the continental and oceanic crusts. Then they analyze the results. They can be assigned the task of researching the percentages.
Curated OER
Heads-Up Probability
Second graders use tree diagrams to predict the possible outcomes of coin tosses. The data they collect and graph also help them predict the likelihood of getting heads or tails when tossing coins the next time.
Curated OER
Water Survey
Students investigate water usage for the average home with the help of conducting a home survey. The information is collected and organized into a graphic format. Then they analyze the results to formulate an educated opinion about water...
Curated OER
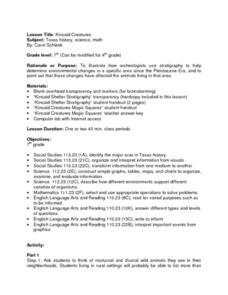
Kincaid Creatures
Young scholars brainstorm a list of nocturnal and diurnal wild animals they see in their community and discuss how the animals would be different if they were living during the Ice Age. Using a handout, they discover how archeologists...
Curated OER
Asian Americans: Where Do They Come From?
Students identify 15 places (14 countries plus Hawaii) from which large populations of Asian Americans originate. They create a graph to help themselves visualize the places from which large populations of Asian Americans originate. Then...
Curated OER
Chart Trivia
Young scholars practice addition and subtraction problems and answer questions using greater than and less than. They chart information to create a graph on the computer.


