University of Chicago
Using Artifacts for Clues About Identity
Learn about the ancient Near East through a close examination of ancient artifacts. Lead your class into analysis by first observing an artifact as a class. Pupils can then work in pairs to analyze the other artifacts and compile a list...
Florida Center for Reading Research
Comprehension: Text Analysis, Compare and Contrast
Grab any two topics, some index cards, and a couple of kids, and you're ready to compare and contrast! The resource provides instructions for this method and three graphic organizers in addition to or in place of the index cards.
Beyond Benign
Decision Graphic Introduction
E is for economics, environment, and social equity. The fifth installment of a 15-part series has scholars first considering ecological impacts, such as determining how much water it takes to produce a can of soda. They then use decision...
K20 LEARN
You’re The Network: Data Analysis
How do you rate? Young scholars use graphical data to analyze ratings of different television episodes. Their analyses include best-fit lines, mean, median, mode, and range.
Statistics Education Web
Are Female Hurricanes Deadlier than Male Hurricanes?
The battle of the sexes? Scholars first examine data on hurricane-related deaths and create graphical displays. They then use the data and displays to consider whether hurricanes with female names result in more deaths than hurricanes...
Curated OER
"Data Dabble"
Students engage in a lesson plan which facilitates their use of web sites to find data, graph it, and interpret it, thus scaffolding graphing skills to prepare students for their 8th grade I-search exit project.
Curated OER
Bloodstain Pattern Simulations: A Physical Analysis
Students receive bloodstain pattern evidence from a crime scene. They answer a series of questions through inquiry, observation, measurement, and analysis. Pupils complete this challenge, by reconstructing the evidence through four...
Curated OER
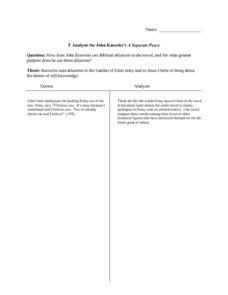
A Separate Peace - T Analysis
Reading A Separate Peace? Readers analyze important quotes that appear in John Knowle's classic novel using the provided graphic organizer. Learners record a passage and provide an accompanying analysis for each entry. Consider having...
Monarch High School
TP-CASTT Practice
Acronyms can help learners remember facts and analyze poetry. This resource includes graphic organizers for TP-CASTT, SOAPS, SOAPSTone, and DIDLS. Class members can try out one or all of these strategies to assist with that difficult job...
EngageNY
Reviewing Visual Elements of a Graphic Novel: Max Axiom
Pass the tea! Using the resource, scholars participate in a Tea Party protocol to analyze text and images about inventions that helped meet societal demands. After sharing their observations with each other, they discuss visual elements...
Curated OER
Data, Data, Everywhere... and What Am I To Think?
Students demonstrate good random sampling techniques for data collection, select and develop graphic presentations of data and analyze the data to solve a problem presented.
Howard Hughes Medical Institute
Lactase Persistence: Evidence for Selection
What's the link between lactase persistence and dairy farming? Biology scholars analyze data to find evidence of the connection, then relate this to human adaptation. Working individually and in small groups, learners view short video...
EngageNY
Reading Literature about Natural Disasters: Inferring about Human Impact through an Analysis of Eight Days: A Story of Haiti
This is a disaster. Scholars look through the book Eight Days: A Story of Haiti and discuss their wonderings about the text and natural disasters. They then complete a first read to determine gist and second read to answer text-dependent...
Radford University
Danger! – An Analysis of the Death Toll of Natural Disasters
Decipher the danger of natural disasters. Using researched data, scholars work in groups to create data displays on the number of deaths from different types of natural disasters. They share their graphical representations with the class...
Radford University
Geyser Graphical Activity
Thar she blows! An engaging activity teaches pupils about geysers. They first read information about the Strokkur geyser in Iceland and analyze data on its eruptions by creating multiple data representations. Once finished, they research...
Center for History Education
Helping to Move On? An Analysis of the Reconstruction Amendments
Reconstruction amendments: a helping hand or another form of slavery? An inquisitive lesson compares the Reconstruction legislation that ended slavery, granted citizenship, and protected voting right for African American men. Scholars...
EngageNY
Mid-Unit Assessment: On-Demand Note-Taking, Analysis, and Reflection: “Should We Drill?”
Pupils take a mid-unit assessment, completing a point of view graphic organizer based on an informational article about offshore drilling. Next, learners answer text-dependent and short-answer questions about the text.
K20 LEARN
We've Got Character! Literary Analysis: Characterization
How authors bring characters to life and make them believable is the focus of a lesson on characterization. Readers closely examine passages from To Kill a Mockingbird and Dreamland Burning, noting details that reveal the character's...
Curated OER
Opinion Poll-arities
Learners explore the mathematics behind opinion polls, as well as provides a framework for interpreting trends in opinion poll graphics.
Mathematics Assessment Project
Interpreting Distance–Time Graphs
Pre-algebra protégés critique a graph depicting Tom's trip to the bus stop. They work together to match descriptive cards to distance-time graph cards and data table cards, all of which are provided for you so you can make copies for...
Curated OER
Unknown Frost Poem Discovered
What? A long-lost poem from Robert Frost? Introduce your class to a poem recently found and published from Robert Frost's personal collection. The lesson includes background information on the author, the poem itself, and a list of...
Curated OER
Are We Couch Potatoes or Busy Bees? Data Analysis of Physical Activity in School
Young scholars study practical data analysis within the constraints of the scientific method. In this data lesson plan students collect and enter data into a computer spreadsheet then create graphs.
PBL Pathways
College Costs 2
What is the financial benefit for attending a community college for the first two years before transferring to a four-year college? The second part of the educational lesson asks young scholars to explore this question through data...
National Council of Teachers of Mathematics
Eruptions: Old Faithful Geyser
How long do we have to wait? Given several days of times between eruptions of Old Faithful, learners create a graphical representation for two days. Groups combine their data to determine an appropriate wait time between eruptions.


