Alabama Learning Exchange
Technology for Displaying Trigonometric Graph Behavior: Sine and Cosine
Learners explore the concept of sine and cosine. In this sine and cosine lesson, students work in groups to graph sine and cosine functions. Learners examine how coefficients in various parts of each parent function shift the...
Curated OER
Build a Skittles Graph
Students construct a bar graph with a given set of data. They calculate the ratio and percent of the data. Students discuss alternate ways of graphing the data as well as multiple strategies to approach the task.
Curated OER
Shell Graphing
Fifth graders explore the four quadrants of a coordinate grid. In this graphing lesson, 5th graders trace sea shells in each of the four quadrants of a coordinate grid and then label the ordered pairs on each shell. For the...
Curated OER
Graphing Equations
For this algebra worksheet, students solve linear equations through evaluations and graphing. There are 76 questions ranging from addition to division of linear equations.
Curated OER
Polar Graphs
Students graph polar graphs. In this calculus lesson, students convert between polar and rectangular coordinates. They graph their solution on the TI calculator and make observations.
Curated OER
A Reading Graph
Learners construct and interpret a "favorite classroom books" graph. In this literacy and math graphing lesson, students choose a reduced size copy of the book cover that corresponds with the book(s) they chose to read during their...
Texas Instruments
Data Collection for Bar Graphs
Learners study the concept of central tendency in this data collection for bar graph lesson. They collect data outside as instructed and organize it into a bar graphs, then they list in specific groups the labels that appear on the...
Curated OER
Study Buddies: Reading Line Graphs
In this math worksheet, students will work with a coach to solve a problem by reading a line graph. Students will follow a step-by-step process and notes are provided for the coach.
Curated OER
Data! Data! Graph that Data!
Fifth graders create data graphs using Microsoft Excel. In this data collection lesson, 5th graders create and conduct a survey, then use Excel to organize and graph their data.
Curated OER
Creating a Spreadsheet and Graph
Students create graphs in Excel. In this spreadsheet lesson, students input data into spreadsheet cells then use the graphing feature of the Excel program to produce colorful graphs of the data. The directions to create the...
Curated OER
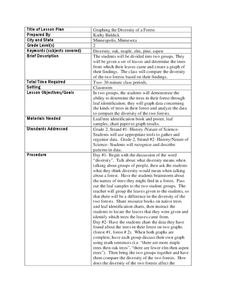
Graphing the Diversity of a Forest
Second graders work in groups to identify what types of trees create which types of leaves For this plant life lesson plan, 2nd graders analyze a set of leaves and identify the tree it came from while graphing the data in a science...
Curated OER
Solving a Pair of Linear Equations by Graphing
Teach your math lovers how to solve linear equations by graphing. Learners identify pairs of coordinates and use it to graph a line and use the TI to graph and observe the line.
Curated OER
Graph Logarithms
Mathematicians graph logarithmic equations. Teach your students how to identify the intercepts of logarithmic equations and tell whether the function is increasing or decreasing. They find the domain and range of each function.
Curated OER
Weather, Data, Graphs and Maps
Students collect data on the weather, graph and analyze it. In this algebra instructional activity, students interpret maps and are able to better plan their days based on the weather reading. They make predictions based on the type of...
Curated OER
Concavity of a Graph
Learners explore the graph of a function. In this calculus lesson plan, students identify when and where the graph is increasing or decreasing. They identify if it concave up or down by moving the cursor.
Curated OER
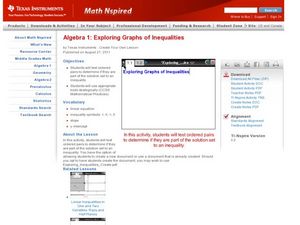
Exploring Graphs of Inequalities
Learn how to solve inequalities and graph their answers. Students use addition, subtraction, multiplication and division to solve problems. They analyze their graph using the TI calculator.
Curated OER
Graph Paper
Students are given pre-made graph paper. In this algebra instructional activity, students are given copies of graph paper that can be used to plot points on a coordinate plane already measured out.
Curated OER
Graphing Memories
Mem Fox’s Wilfrid Gordon McDonald Partridge provides the labels for a graphing activity. Class members create an illustration of a memory item brought from home, and place their illustration in the proper column of a graph. When the...
Curated OER
Graph Lesson
First graders collect data on different eye colors of each student in their classroom. They input the data that they gathered in an Excel spreadsheet and then create a graph in Excel.
Curated OER
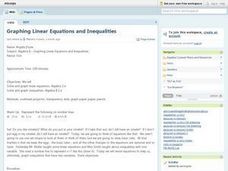
Graphing Linear Equations and Inequalities
Students discuss methods to solve equations and inequalities with one variable. As a review, they write Addition and Subtraction properties of equality and Multiplication and Division properties of equality. Students graph points, write...
Virginia Department of Education
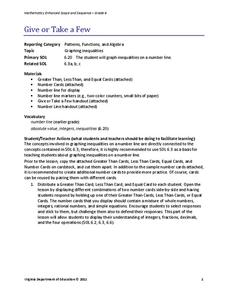
Give or Take a Few
Young mathematicians extend their knowledge of rational numbers on a number line to graph inequalities by first using number cards to compare rational numbers. They finish by using similar reasoning to graph inequalities on a number line.
Virginia Department of Education
May I Have Fries with That?
Not all pie graphs are about pies. The class conducts a survey on favorite fast food categories in a instructional activity on data representation. Pupils use the results to create a circle graph.
Chicago Botanic Garden
Plant Phenology Data Analysis
Beginning in 1851, Thoreau recorded the dates of the first spring blooms in Concord, and this data is helping scientists analyze climate change! The culminating instructional activity in the series of four has pupils graph and analyze...
University of Colorado
Spacecraft Speed
Space shuttles traveled around Earth at a speed of 17,500 miles per hour, way faster than trains, planes, or automobiles travel! In the 13th installment of 22, groups graph different speeds to show how quickly spacecraft move through...
Other popular searches
- Coordinate Graphing Pictures
- Graphing Ordered Pairs
- Graphing Skills Lesson Plans
- Coordinate Graphing
- Graphing Linear Equations
- Holiday Coordinate Graphing
- Graphing Linear Inequalities
- Graphing Calculator
- Graphing Inequalities
- Halloween Math Graphing
- Graphing Mean, Median, Mode
- Graphing Data


