Curated OER
M&M's Candies Worksheet Graph
In this graphing worksheet students will record data on a bar graph. Students will take a bag of M&M's and chart the colors they find inside this bag.
Curated OER
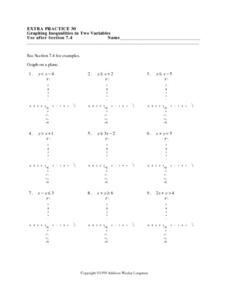
Graphing Inequalities in Two Variables: Extra Practice 30
In this math worksheet, students graph inequalities on a coordinate grid. The eight problems have a coefficient of one for the y variable. Three problems have a negative value for y. The final four problems are horizontal or vertical lines.
Curated OER
Extra Practice 16: Graphs of Quadratic Functions
In this graphing worksheet, learners determine the domain and graph quadratic functions. Coordinate planes are provided below each function. There are 36 problems on this four-page worksheet.
Curated OER
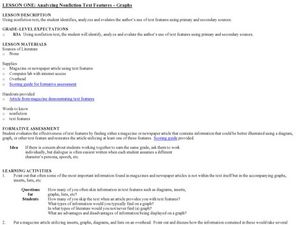
Analyzing Non-Fiction Text Features- Graphs
Students examine the text features of non-fiction. In this literacy lesson, students practice reading graphs and discover the authors intent for using them in primary and secondary sources.
Curated OER
Graphing Linear Equations
Students graph linear equations. In this algebra lesson, students perform transformation on linear equations. They identify the slope and y-intercept of each line.
Curated OER
Making Graphs
Learners explore statistics by conducting class demographic surveys. In this graph making lesson, students identify the family members of each classmate, pets they own, and favorite activities. Learners organize their statistics and...
Curated OER
Favorite Season Circle Graph
Students create a graph charting their favorite season. They discuss the difference in the four seasons and activities they participate in, in each of the seasons. They can also take a survey of their family members and add them to the...
Curated OER
Graphing Data
First graders explore the concept of graphing. In this data lesson, 1st graders gather information from a class survey and display their findings on a picture graph. Students also practice solving problems that their instructor models.
Curated OER
Graphing Linear Equations
Eighth graders examine linear equations by creating graphs from them. In this graphing lesson, 8th graders read several linear equations and plot them on a graph with the help of their classmates. Students find the slope of...
Curated OER
Analyzing Nonfiction Text Features - Graphs
Students examine the text features of non-fiction. In this literacy lesson, students practice reading graphs and discover the authors intent for using them in primary and secondary sources.
Curated OER
Discovering Magnets and Graphs
Sixth graders investigate averages and statistics by discovering magnet strengths. In this magnet experiment lesson, 6th graders utilize different magnets and attempt to attract different materials to them. Students record...
Curated OER
Graphing Trash Material
Students investigate data and recyclable materials. In this math lesson, students save recyclable materials and create a graph of the materials. Students discuss how they could help the environment by recycling.
Curated OER
Bar Graphs with Tally Marks
Students classify buttons into categories, create and interpret a tally table and bar graph, and add and subtract numbers.
Curated OER
Graph Paper 2
In this blank graph paper worksheet, students use the gridded sections that may be marked off on the x and the y axis as directed by their teachers.
Curated OER
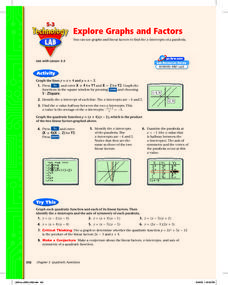
Explore Graphs and Factors
Pupils graph the factors of a quadratic as linear equations and graph the parabolic equation in factored form. Also, they investigate the relationship between the x-intercepts of the lines and the zeros of the parabola.
Curated OER
Mass/Weight/Data/Graphing-What Is The Mass of a Dinosaur?
Students determine the mass of various "dinosaur eggs" and graph their data. In this mass, weight, data and graphing lesson plan, students measure the mass of different weighted "dinosaur eggs". They record their data and transfer it to...
Curated OER
More graphing situations by making a table
Students make a table and graph plotting points. In this algebra lesson, students graph linear equations on a coordinate plane. They calculate the rate of change and analyze the graph for extrapolation.
Curated OER
Practice Graphing y = mx + b
Ninth graders graph linear equations of the form y= mx + b. In this algebra lesson, 9th graders are able to graph a line given the slope and y-intercept. They can write the equations of a line given the graph of a line and can...
Curated OER
Graphing Situations without a Table
Students graph a line without making a table of vales. In this algebra lesson plan, students are given a verbal scenario and asked to write a linear functions representing the scenario and graph it on a number line without making a...
Curated OER
Apple Graph
Students sample three types of apples. They choose their favorite apple. They create a graph, charting the favorite apples of their classmates. They answer a series of questions.
Curated OER
Pizza Possibilities
Students create and interpret line plots, bar graphs, and circle graphs. The lesson assumes mastery of conversions from fraction to decimal to percent, construction of angles, and at least an introduction to graphs displaying data.
Curated OER
And the Survey Says...
Create a survey and graph! In this graphing instructional activity, students listen to a story about pets, create a survey for family and friends about what pets they own, and use the information to create a bar and line graph.
Curated OER
Representing Data
Second and third graders answer questions based on data presented to them in graphs. They see how to interpret data from a bar graph, line graph, and a chart.
Curated OER
Survey Says...
Young learners create and implement a school-wide survey about student body favorites! Learners record and analyze the data on a bar graph, picture graph, and line graph, and then display the data. Then, wrap it all up with a celebration...
Other popular searches
- Coordinate Graphing Pictures
- Graphing Ordered Pairs
- Graphing Skills Lesson Plans
- Coordinate Graphing
- Graphing Linear Equations
- Holiday Coordinate Graphing
- Graphing Linear Inequalities
- Graphing Calculator
- Graphing Inequalities
- Halloween Math Graphing
- Graphing Mean, Median, Mode
- Graphing Data


