Curated OER
Class Color Count
Students use the internet to research when different groups of people received the right to vote in the United States. As a class, they hold an election to determine the favorite color of the class. To end the lesson plan, they take the...
Curated OER
Problem Solving with the Wilderness Classroom
Learners complete 45 multiple choice math word problems. In this math word problems lesson plan, students solve word problems on time, graphing, all four operations, money, and more.
Curated OER
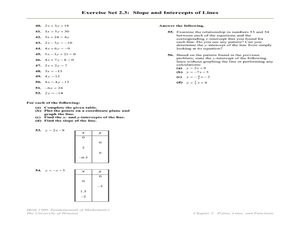
Slope, Intercepts, and Graphing a Line
In this intercepts and slope worksheet, students find the slope and/or the x and y-intercepts in fifty-three problems. Students also graph lines using the x and y-intercepts.
NOAA
Graphing Temperatures
Battle of the hemispheres? In the fourth installment of a five-part series, young oceanographers use the NOAA website to collect temperature data from drifters (buoys), one in the Northern Hemisphere and one in the Southern Hemisphere....
Anti-Defamation League
Pink Collar Jobs: Gender Segregation and Pay Inequality in the Workplace
Cartoons showing women in the workplace spark a discussion about being a business executive and claiming the corporate ladder. Small groups analyze data and create graphs that display essential information from the handouts. The class...
Curated OER
Three for the Money: The Degree/Diameter Problem
Students explore the degree, diameter, planarity, and size of graphs. In this degree, diameter, planarity, and size of graphs lesson, students try to construct a graph with more than 12 vertices that satisfy all other...
Chicago Botanic Garden
Historical Climate Cycles
What better way to make predictions about future weather and climate patterns than with actual climate data from the past? Young climatologists analyze data from 400,000 to 10,000 years ago to determine if climate has changed over...
National Security Agency
Are You Ready to Call the Guinness Book of Records?
Learners design questions that can be answered by collecting data. For this line-plot lesson, pupils collect data and graph on a line plot on world records. An abundant supply of teacher support is provided in this resource.
Cornell University
Non-Newtonian Fluids—How Slow Can You Go?
Children enjoy playing with silly putty, but it provides more than just fun. Young scientists make their own silly putty using different recipes. After a bit of fun, they test and graph the viscosity of each.
Curated OER
Scatter-Brained
Seventh graders graph ordered pairs on a coordinate plane. They create a scatterplot. Additionally, they determine the line of best fit and investigate the slope of the line. Multiple resources are provided. An excellent resource!
Curated OER
Hand Span and Height
Is there a relationship between hand span width and height? Statisticians survey each other by taking measurements of both. A table that can hold data for 24 individuals is printed onto the worksheet, along with questions for analysis....
Curated OER
Energy Audit
Students collect data about energy usage and use mathematical calculations to analyze their data. In this energy conservation and statistics math lesson, students survey their homes to complete an energy usage worksheet. Students...
Curated OER
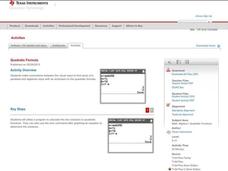
Quadratic Formula
This worksheet is part of the TI-Nspire lesson on the quadratic formula. Pupils determine the solutions of a quadratic function by looking at a graph and the discriminant. They use the quadratic formula to solve quadratic functions on...
Curated OER
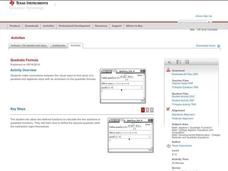
Quadratic Formula
Mathematicians determine the solutions of a quadratic function by looking at a graph. They use the quadratic formula to solve quadratic functions on their Ti-Nspire.
Curated OER
Graphing Linear Equations Using Data Tables
Students review the Cartesian plane and the process of plotting points. In groups, students create tables, identify the slope and y-intercept, and graph the equation. Afterward, students perform the same process, only, individually. As a...
Curated OER
Graph Lab
Seventh graders explore bar graphs and pie charts. Given a pack of M&Ms, 7th graders explore the colors, sort the data in a frequency chart and then construct bar graphs and pie charts to categorize the M&Ms by color. Students...
Curated OER
Graphing Functions With 2 Points and From a Graph
Learners plot points on a coordinate plane. They describe, in words, methods for finding the slope of a line. After given a worksheet, students read instructions, draw a Cartesian plane, plot ordered pairs, and graph lines. Papers are...
Curated OER
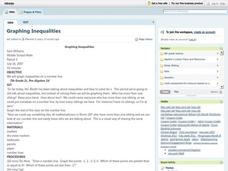
Graphing Inequalities
Students graph inequalities on a number line and discuss how to solve for one variable. The teacher models examples as students take notes. In groups, students participate in an activity to demonstrate inequalities on a number line. ...
Curated OER
Graphing Changes in Weather
Students graph current temperature and weather conditions for three days. In this weather instructional activity, students go to the Weather Channel's website and look up weather for their zip code then graph the conditions and...
Curated OER
How Many More on a Graph?
First graders identify a number that is one more or one less than a number up to one hundred and identify a mystery number. They also create a class graph that illustrates how many children are in each family, and answer questions about...
Curated OER
Graphing : research and record information
First graders create graphs. In this graphing lesson, 1st graders create a floor graph using their bodies to record information. They create picture graphs after collecting information.
Virginia Department of Education
Transformation Investigation
Graph it! Investigate transformations with a graphing calculator. Pupils graph sets of linear functions on the same set of axes. They determine how changes in the equation of a linear function result in changes in the graph.
TryEngineering
Choose Your Best Way
Find the best path through town. The lesson teaches future computer programmers about networks and paths in graph theory. They develop a network of their towns to determine the most efficient path to visit each of their homes.
Curated OER
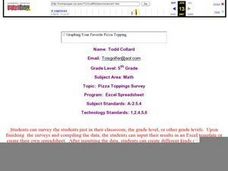
Graphing Your Favorite Pizza Topping
Fifth graders can survey the students just in their classroom, the grade level, or other grade levels. Upon finishing the surveys and compiling the data, the students can input their results in an Excel template or create their own...
Other popular searches
- Coordinate Graphing Pictures
- Graphing Ordered Pairs
- Graphing Skills Lesson Plans
- Coordinate Graphing
- Graphing Linear Equations
- Holiday Coordinate Graphing
- Graphing Linear Inequalities
- Graphing Calculator
- Graphing Inequalities
- Halloween Math Graphing
- Graphing Mean, Median, Mode
- Graphing Data


