Curated OER
An Immigration Graph
Students practice reading and understanding information in a table and converting the information to graph form. They create a graph showing the number of immigrants per country of origin between 1899 and 1924.
Curated OER
Match The Graph Circles
High Schoolers engage in a study of circles and graphs that are related with the focus upon finding the center and radius. The lesson includes the suggestion of giving homework using circle problems before this one to create background...
Curated OER
Graphing Linear Equations
In this linear equations worksheet, students graph linear equations on a coordinate plane. They identify the slope and the y-intercept. This five-page worksheet contains approximately 36 problems.
Curated OER
Coordinate Graphs
Students use coordinate graphs in order to identify objects and their locations. They are shown how to plot the x and y coordinates and then are given values to be plotted during guided and independent practice. Students are assessed on...
Curated OER
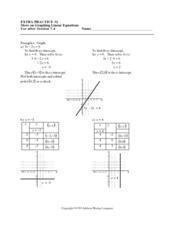
More On Graphing Linear Equations
In this linear equation worksheet, young scholars graph linear equations and identify the x or y-intercept. There are nine graphing equations on this two-page worksheet.
Curated OER
More Graphing With Intercepts
In this graphing worksheet, students graph linear equations. They identify the x or y-intercept. Coordinate planes are available below each equation. Nine problems are provided on this two-page worksheet.
Curated OER
Graph Creator
Students rewrite equations using algebraic symbols. In this algebra lesson, students graph linear equations using the slope and y intercept. They make predictions about their graphs and analyze the results.
Curated OER
Trigonometric Graphing
Students analyze graphs. In this trigonometric instructional activity, students identify the different graphs of sine, cosine and tangent. They graph the inverse of those trig values and identify their properties such as phase shift and...
Curated OER
Proportionality in Tables, Graphs, and Equations
Young scholars create different methods to analyze their data. For this algebra lesson, students differentiate between proportion and non-proportional graph. They use the TI-Navigator to create the graphs and move them around to make...
Curated OER
Coordinate Graphs, Translations and Reflections
Young scholars perform translations and reflections. In this algebra lesson, students use the TI calculator to graph functions. They move the functions around on the coordinate plane using translation and reflection.
Curated OER
Graphing Linear Equations
In this graphing worksheet, pupils graph linear equations. Coordinate planes are provided for each equation. There are 16 equations on this two-page worksheets.
Curated OER
Graphing Integers
Fifth graders explore the math concept of graphing integers. In this graphing integers lesson, 5th graders examine visual examples. Students also practice solving problems that their instructors model.
Curated OER
Graphing Regions: Lesson 2
Young scholars identify and analyze geographical locations of inventors. They each identify where their inventor is from on a U.S. map, discuss geographic patterns, and create a t-chart and graph using the Graph Club 2.0 Software.
Curated OER
Graph It!
Learners create a graph with a title, labels, scales and intervals independently. They then take the opportunity to evaluate graphs created by classmates using a peer evaluation sheet.
Curated OER
Graphing
Students gather statistical information on a chosen topic and place it into a spreadsheet. Using th Excel chart wizard, students create tables, graphs and charts of their information. They interpret the data and share it with the class.
Curated OER
Tally Charts and Graphs
Fourth graders play the game 'Data Picking', where they collect data, place the data into a tally chart, and choose the circle graph that best represents the data. They go to the Mathfrog website and select 'Picking'. Students choose...
Curated OER
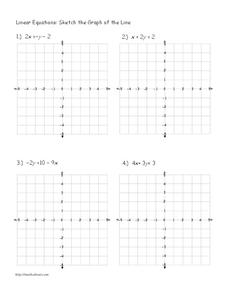
Linear Equations: sketch the graph of the line
In this linear equations worksheet, students sketch the graph of the lines given to them. Students draw the lines of 4 linear equations on 4 graphs.
Curated OER
Savings Planning Using Tables, Line Graphs and Early Proportionality
Students use proportional reasoning to make a chart of daily savings transactions and balances. In this accounting lesson, students read word problems and complete three handouts about a bidding and accounting problem. Students finish...
Curated OER
Algebra/Geometry Institute Summer 2007: Graphing Activity
Seventh graders practice identifying coordinates by examining a city map. In this graphing lesson plan, 7th graders create coordinate directions on an index card and practice locating these locations on a grid. Students read...
Curated OER
Functions and Their Graphs.
Students solve equations and label it as a function or not. In this algebra lesson, students make a table of values and graph their equation. They identify the domain and range of each graph.
Curated OER
Graphing Our Marbles
Students collect information pertaining to marble colors found in their bag; then creating a spreadsheet in order to make a chart representing their findings using Microsoft Excel. Students will present their results to small groups.
Curated OER
Jump and Graph
Third graders practice measuring skills by jumping and measuring the lengths with yardsticks. After measuring five jumps each, they draw bar graphs representing their jumps.
Curated OER
Student Costs Graph
Students calculate the mileage, gasoline costs, and travel time and costs for a vacation. They conduct a virtual field trip, and create a comparison graph of costs using Microsoft Excel software.
Other popular searches
- Coordinate Graphing Pictures
- Graphing Ordered Pairs
- Graphing Skills Lesson Plans
- Coordinate Graphing
- Graphing Linear Equations
- Holiday Coordinate Graphing
- Graphing Linear Inequalities
- Graphing Calculator
- Graphing Inequalities
- Halloween Math Graphing
- Graphing Mean, Median, Mode
- Graphing Data


