Curated OER
Graphs and Spreadsheets
Students collect data and present it in a graph and/or a spreadsheet, depending on their previous understanding of technology.
Curated OER
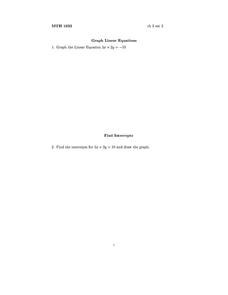
Graph Linear Equations
In this linear equation worksheet, students graph linear equations and find intercepts. This two-page worksheet contains five problems.
Curated OER
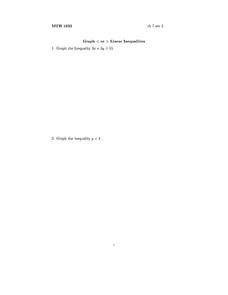
Graph Linear Equations
In this linear equation worksheet, students use basic operations to simplify and graph inequalities. This two-page worksheet contains three problems.
Curated OER
Graphing Dairy Production Statistics
Learners collect data about dairy production. In this geometry lesson, students formulate and model problem solving. They collect data and plot it on a graph.
Curated OER
Exploring F function Graphs
Using three set of data that relate temperature to another variable, 10th graders will use graphs, tables, or equations to make predictions about data. Students will identify the relations as linear or non-linear. Students will define...
EngageNY
Geometric Interpretations of the Solutions of a Linear System
An intersection is more than just the point where lines intersect; explain this and the meaning of the intersection to your class. The 26th segment in a 33-part series uses graphing to solve systems of equations. Pupils graph linear...
Texas Instruments
Finding Linear Models Part III
Explore linear functions! In this Algebra I lesson, mathematicians graph data in a scatter plot and use a graphing calculator to find a linear regression and/or a median-median line. They use the model to make predictions.
Curated OER
The "U's" Have IT!
Students explore the maximum and minimum values of parabola. In this exponential equations lesson, students use graphing calculators or TI Interactive Software to calculate values of parabola and graph x-intercepts of parabola.
Chicago Botanic Garden
Plant Phenology Data Analysis
Scientists monitor seasonal changes in plants to better understand their responses to climate change, in turn allowing them to make predictions regarding the future. The last activity in the series of six has scholars analyze BudBurst...
West Contra Costa Unified School District
Conics Introduction and Parabolas
Where did conic sections get their name? The equation and graph of a parabola are developed from the definition of the conic section. Teacher examples on graphing the equation and writing an equation from the graph round out the plan.
West Contra Costa Unified School District
Comparing Rational Functions and Simplified Functions
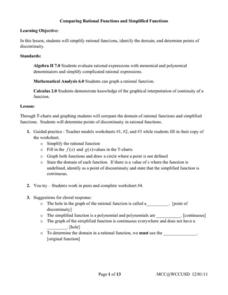
What kind of functions have holes in their graphs? Here, the teacher guides the class on how to use the simplified function of a rational function to aid in the graphing of the original rational function. T-tables are used in order...
EngageNY
Awkward! Who Chose the Number 360, Anyway?
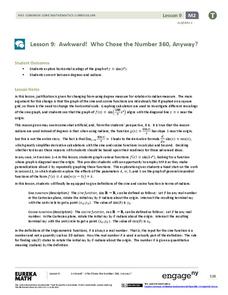
Don't give your classes the third degree. Use radians instead! While working with degrees, learners find that they are not efficient and explore radians as an alternative. They convert between the two measures and use radians with the...
West Contra Costa Unified School District
Shifting Linear Equations in Function Notation
Time for a shift in thinking! Learners examine translations of linear functions. They use function notation to describe the translation and make connections to the graph.
EngageNY
There is Only One Line Passing Through a Given Point with a Given Slope
Prove that an equation in slope-intercept form names only one line. At the beginning, the teacher leads the class through a proof that there is only one line passing through a given point with a given slope using contradiction. The 19th...
Curated OER
Graphing the Four Forces
Using the Cartesian coordinate system, future flight experts plot points to determine whether or not an airplane will fly. With the four forces of weight, lift, drag, and thrust represented in different quadrants, your physics learners...
National Research Center for Career and Technical Education
Safety and Sanitation
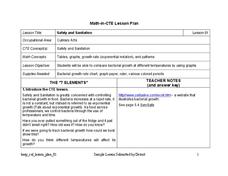
Your microbiologists explore the graphing of exponential growth functions using bacteria, like e. coli and salmonella, in a well-written, career and technology lesson plan.
EngageNY
The Height and Co-Height Functions of a Ferris Wheel
Show learners the power of mathematics as they model real-life designs. Pupils graph a periodic function by comparing the degree of rotation to the height of a ferris wheel.
Teach Engineering
Forms of Linear Equations
Linear equations are all about form. The fifth part in a unit of nine works with the different equivalent forms of linear equations. Class members become familiar with each form by identifying key aspects, graphing, and converting...
TryEngineering
Networks
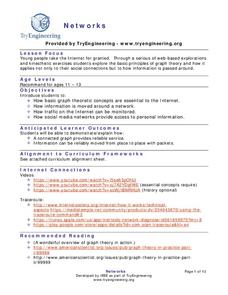
Ever wonder how the Internet works? The lesson teaches scholars the basics of graph theory and how it applies to the Internet. They perform simulations to see how information is sent on the Internet.
Virginia Department of Education
Rational Functions: Intercepts, Asymptotes, and Discontinuity
Discover different patterns by making connections between a rational function and its graph. An engaging lesson asks scholars to explore the behavior of different rational functions. Groups discover a connection between the function...
Ohio Department of Education
I Can Do This! Systems of Equations
Use tables, graphs, and substitution to solve systems of linear equations. An envelope of sample problems is passed around the classroom, and each learner has the opportunity to solve the system in the envelope. This is a great way to...
West Contra Costa Unified School District
Solving Systems of Inequalities
Don't throw away those transparency sheets just yet! Young scholars first review inequalities on a number line, then learn about graphing inequalities in the coordinate plane. Finally, they use overhead transparencies to create systems...
Curated OER
Bouncing Ball
High schoolers collect height versus time data of a bouncing ball using the CBR 2™ data collection device. Using a quadratic equation they graph scatter plots, graph and interpret a quadratic function, apply the vertex form of a...
Institute of Electrical and Electronics Engineers
Coloring Discrete Structures
What's the least number of colors needed to color a U.S. map? The lesson begins by having pupils view a video clip on continuous and discrete phenomenon, then launches into an activity reminiscent of Zeno's paradox. A separate video...
Other popular searches
- Coordinate Graphing Pictures
- Graphing Ordered Pairs
- Graphing Skills Lesson Plans
- Coordinate Graphing
- Graphing Linear Equations
- Holiday Coordinate Graphing
- Graphing Linear Inequalities
- Graphing Calculator
- Graphing Inequalities
- Halloween Math Graphing
- Graphing Mean, Median, Mode
- Graphing Data


