Curated OER
Scientific Method for Middle Schools
Students use the scientific method to solve a teacher scenario. They bring in M&M's. Students are given a copy of the scientific method. They first come up with a problem. Students are told that they are going to conduct an...
Curated OER
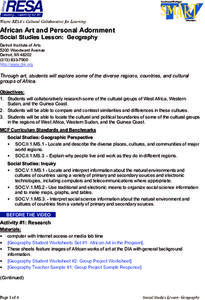
Geography
Young scholars work together in groups to research the cultural groups of West Africa, Sudan and the Guinea Coast. They compare and contrast each culture and locate the political and cultural boundaries on a map.
Curated OER
Exploring Geometric Patterns and Relationships
Sixth graders explore different geographic relationships in like drawing lines, rays, and parallelograms. This lesson could be used for review because it covers more than one concept. The students should have prior knowledge.
Curated OER
Bubblegum balls
Students look for patterns to solve problems involving statistics using different colored gumballs. They should be able to look for and find out all the possible outcomes based upon inference and trials.
Curated OER
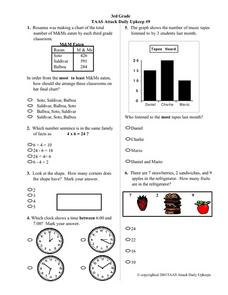
3rd Grade TAAS Attack Daily Upkeep #9
In this math literacy worksheet, 4th graders practice interpreting the pictographs in order to assemble the information to find the solutions to the 13 problems.
Curated OER
Has Change Been Good for Texas?
Fourth graders identify the events and inventions that have caused a change in the state of Texas. Using the internet, they research the year these took place and create a timeline. They identify the positive or negative impact of each...
Curated OER
Animals That Fly or Do Not Fly
Students create a chart and classify animals according to if they can or cannot fly. They find and cut out pictures of the animals and glue them in the correct place on the chart.
Curated OER
Modeling Forest Fires Using Probability
Students explore forestry. They discuss creating fire breaks to control forest fires. Students create models to determine the best way to manage forest fires. They discuss current techniques of forest management.
Curated OER
Berry Basket Painting
Students use plastic berry baskets to make different print designs with paint.
Curated OER
PASS the Arts
Students explore math and art concepts, create digital art examples of the concepts, and incorporate these works into a PowerPoint portfolio with explanation and analysis.
Curated OER
Discover Science
Learners practice scientific research skills. In this lesson about science, students gain experience with the following skills: comparison, observation, identification, and data gathering. Learners will go from station to station and...
Curated OER
Weather Forecasting Basics
Eighth graders analyze weather diagrams and weather maps. In this earth science instructional activity, 8th graders explain why it is important to know the weather. They complete a handout at the end of the instructional activity.
Curated OER
How Can You Study Things You Can’t See Like: Atoms?
Students simulate how scientists studied things they can't see like atoms. In this chemistry lesson, students predict what is inside the numbered obsertainers. They design a way to investigate what's inside without opening it.
US Department of Education
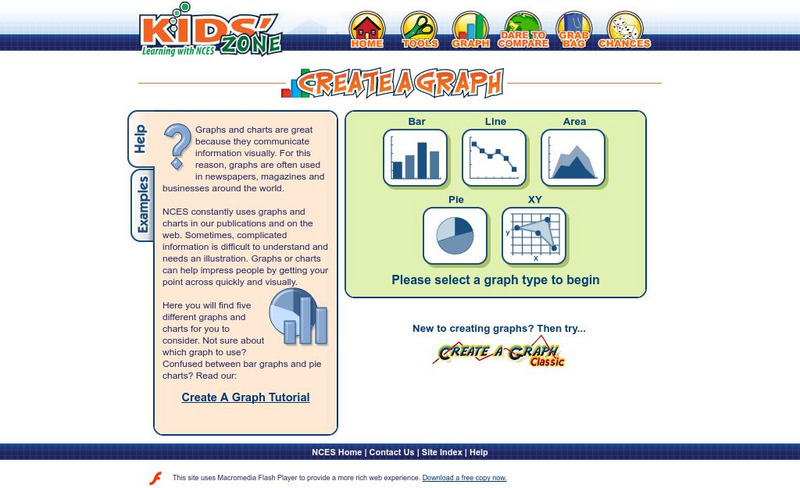
Nces: Create a Graph: Kids Zone
Make your own pie, bar, line, area or XY graph with this interactive tool. Look for examples of graphs already created from data collected by the National Center for Education Statistics. Complete with a graphing tutorial.
US Department of Education
Nces Kids' Zone: Create a Graph
Resource from the National Center for Education Statistics allows you to create great bar graphs. Simply enter your information, choose appropriate colors, and voila!- you have a beautiful graph you can turn put into your report!
CK-12 Foundation
Ck 12: Physical Science: Scientific Graphing
[Free Registration/Login may be required to access all resource tools.] Usefulness and types of graphs.
Better Lesson
Better Lesson: Circle Graph Activity
This instructional activity will allow the student to work through three stations. The stations will focus on creating and analyzing circle graphs. The students will be using technology to create their graphs along with a hands on...
CK-12 Foundation
Ck 12: Physical Science: Position Time Graphs
[Free Registration/Login may be required to access all resource tools.] How motion and speed can be represented by a distance-time graph and how average speed can be calculated from it.
CK-12 Foundation
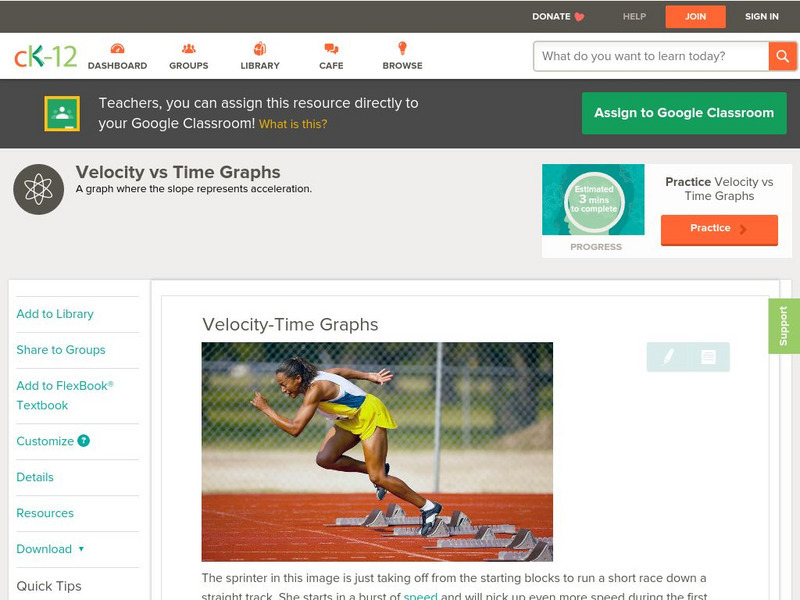
Ck 12: Physical Science: Velocity Time Graphs
[Free Registration/Login may be required to access all resource tools.] How to draw a velocity-time graph and what it represents.
Texas Education Agency
Texas Gateway: Scientific Investigation and Reasoning Data Organization
Using interactive exercises, students will review how to construct tables and graphs in order to organize data.
American Museum of Natural History
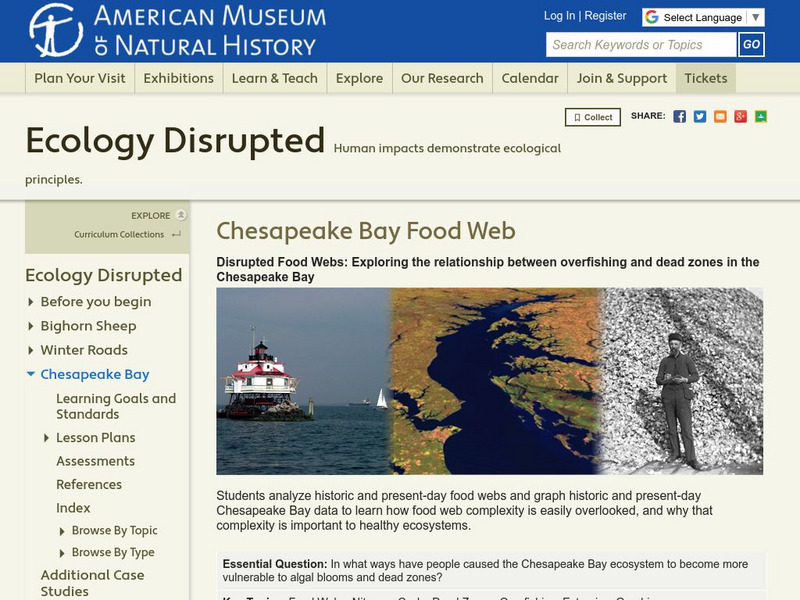
American Museum of Natural History: Ecology Disrupted: Chesapeake Bay Food Web
In this comprehensive instructional activity unit, students examine how overfishing has affected Chesapeake Bay's ecosystem. They will study food webs from the past and present and graph related data.
TeachEngineering
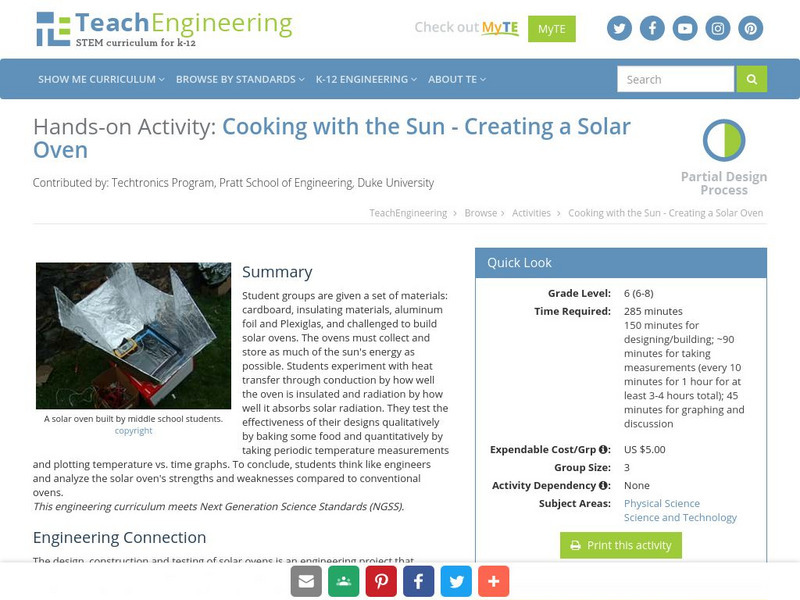
Teach Engineering: Cooking With the Sun Creating a Solar Oven
For this activity, students will be given a set of materials: cardboard, a set of insulating materials (i.e. foam, newspaper, etc.), aluminum foil, and Plexiglas. Students will then become engineers in building a solar oven from the...
TeachEngineering
Teach Engineering: Digest Your Food!
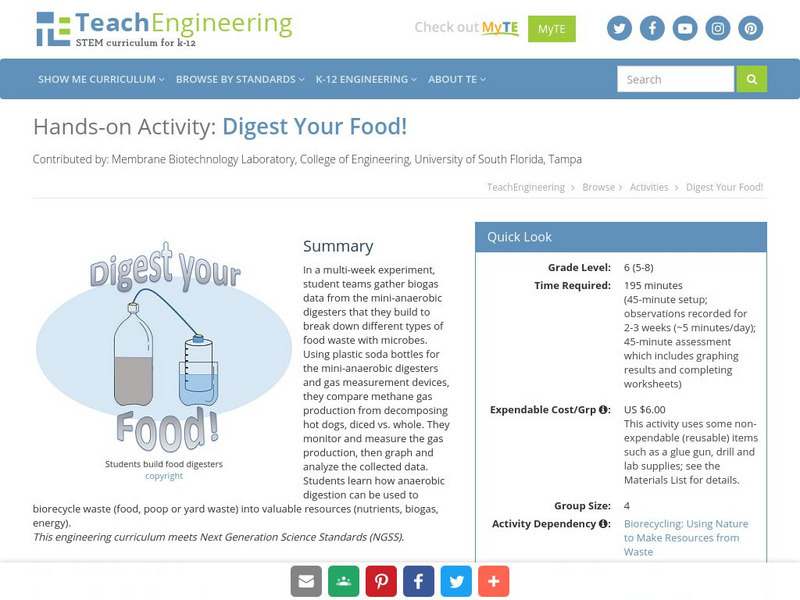
In a multi-week experiment, student teams gather biogas data from the mini-anaerobic digesters that they build to break down different types of food waste with microbes. They compare methane gas production from decomposing hot dogs,...
US Energy Information Administration
Energy Information Association: u.s. Household Electricity Report
The report provides an overview of the electricity consumption in households in 2001. End-use (lighting, appliances, heating) data is presented in written, graph and table form. Background on efficiency standards and regional factors...


