Other
The Learning Partnership: Journey to El Yunque
In this set of learning modules, students examine the impact of hurricane weather on the El Yunque rainforest in Puerto Rico. They learn about hurricanes, producers, consumers, and the food chain, and how disruptions in organisms'...
Texas Education Agency
Texas Gateway: Speed, Velocity, and Acceleration
Given descriptions, illustrations, graphs, charts, or equations, students will differentiate between speed, velocity, and acceleration.
Texas Education Agency
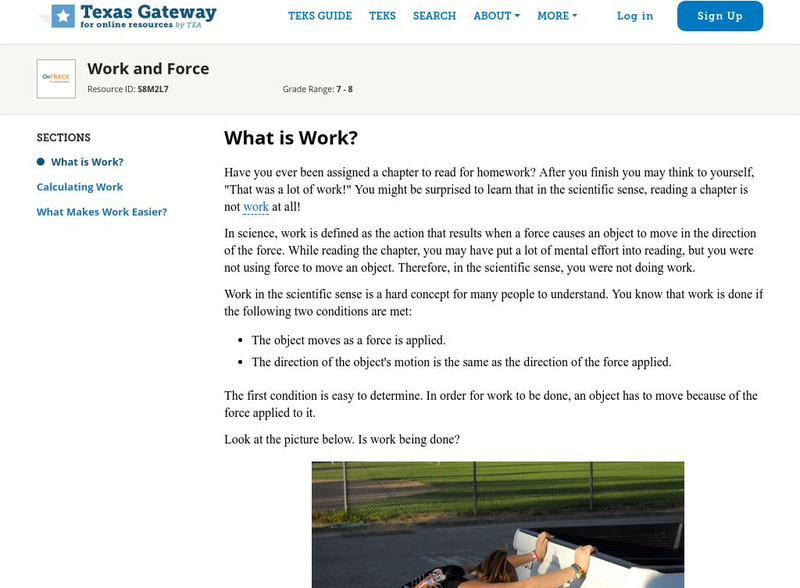
Texas Gateway: Work and Force
Given descriptions, illustrations, graphs, or charts, students will contrast situations where work is done with different amounts of force to situations where no work is done, such as moving a box with a ramp and without a ramp or...
US Energy Information Administration
U.s. Eia Energy Kids: Nonrenewable Energy Sources
This resource provides information about nonrenewable energy sources. There is specific information about each of these energy sources, and lots of maps, charts, tables, and graphs to further the understanding.
Howard Hughes Medical Institute
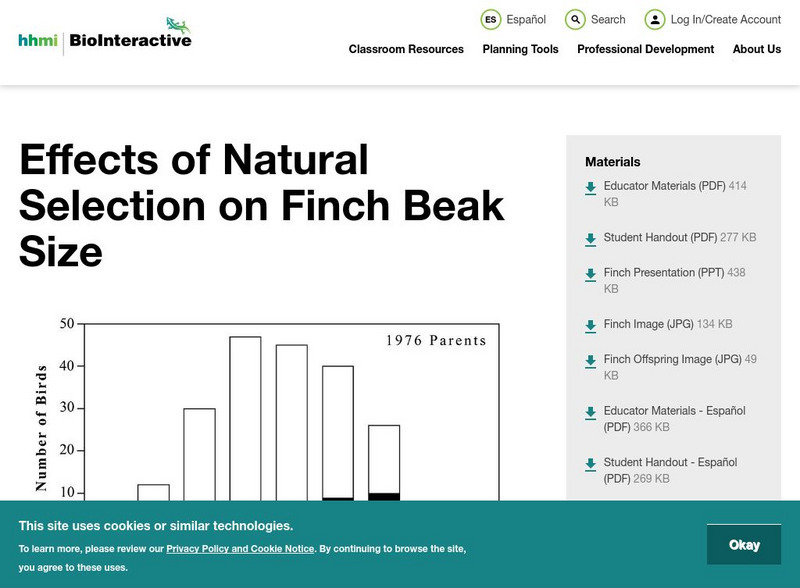
Hhmi: Bio Interactive: Effects of Natural Selection on Finch Beak Size
In this activity, learners examine research on finches on the island of Daphne Major in the Galapagos Islands. The depth of the finches' beaks was measured before and after a drought. This data is displayed in graphs and students are...
Texas Instruments
Texas Instruments: Jason: Island Fox: A Population in Trouble
Examine the relationship between the island fox and golden eagle populations on Santa Cruz Island over a twelve-year period using the TI-73 Explorer to graph and analyze the values.
TeachEngineering
Teach Engineering: The Energy Problem
This six-day lesson provides students with an introduction to the importance of energy in their lives and the need to consider how and why we consume the energy we do. The lesson includes activities to engage students in general energy...
TeachEngineering
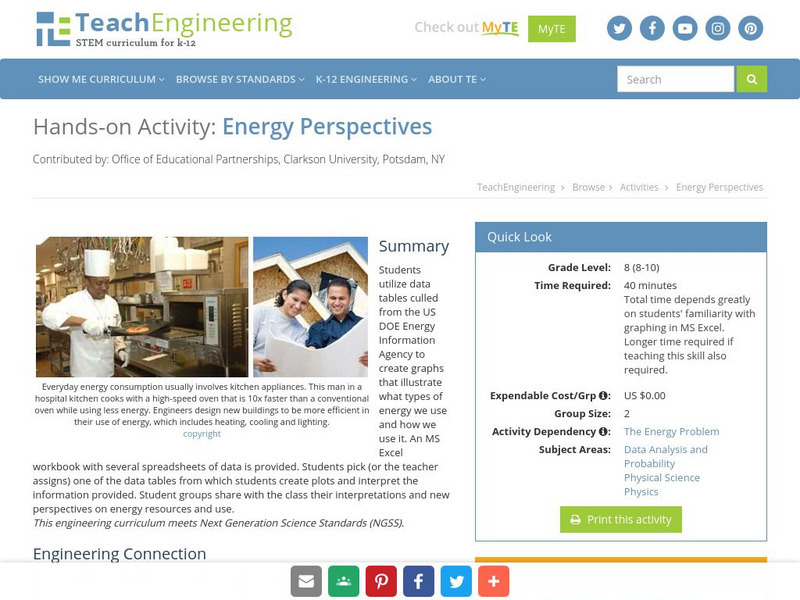
Teach Engineering: Energy Perspectives
Students utilize data tables culled from the US DOE Energy Information Agency to create graphs that illustrate what types of energy we use and how we use it. An MS Excel workbook with several spreadsheets of data is provided. Students...


