Curated OER
Building Storm Shelters
Sixth graders explore area and perimeter. In this online interactive area and perimeter lesson, 6th graders investigate why the perimeter of rectangles can vary considerably even when the area is held constant. Students construct...
Curated OER
Boats Graph
Learners read from the Bible about the travels of Paul, particularly the boat rides. They trace Paul's travels on a map of Asia Minor. Students review a field trip they took and make a graph showing the numbers of each type of boat they...
Curated OER
And the Survey Says...
Learners use technology to input, retrieve, organize, manipulate, evaluate, and communicate information; apply appropriate technologies to critical thinking, creative expression, and decision-making skills. They collect and explore data...
Curated OER
Getting to Know You
Students read a book about understanding differences. In this getting to know you lesson, students sit in a circle, roll a ball to each other and tell one thing about themselves when they get the ball. Students read the book One and...
Curated OER
Lift vs. Airspeed
Young scholars, after reading the explanation given below, use FoilSim and a graphing calculator to complete the activity to determine the relationship between airspeed and lift of an object by interpreting data.
Curated OER
Curveball vs. Fastball
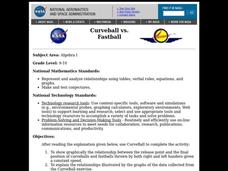
Students graph the relationship between the release point and the final position of curveballs and fastballs thrown by both right and left handers given a constant speed, and explain the relationships illustrated by the graphs of data.
Curated OER
Body Part Measurements
Second graders participate in a review of how to use rulers and yard sticks while collecting measurement information. They measure assigned body parts and chart the data on collection sheets. They make a spreadsheet with the information...
Curated OER
Fly Away With Averages
Learners study mean, median, and mode. They construct paper airplanes and test them to see how far they fly. They measure the distance and then find the averages of their throws. They use spreadsheet software to record the data in a...
Curated OER
Hermit Crab Races
Students predict the speeds of humans and hermit crabs and investigate their predictions using ratios and formulas. AppleWorks is used for this lesson, which includes a data worksheet.
Curated OER
Let's Measure
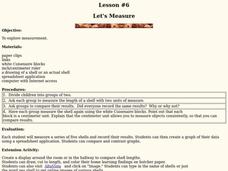
Students measure shells using 3 different methods. In this measurement lesson, students work in two groups to measure the length of a shell using two different units of measure. The groups compare their results, measure the shell again...
Science 4 Inquiry
The Yin and Yang of Photosynthesis: Day vs. Night
Floating fragments of elodea can grow even without roots. Young scientists use eldoea plants to observe the oxygen production from photosynthesis. They study the difference between having access to high amounts of light and low amounts...
Curated OER
TV Viewing
Students test a hypothesis to see if there is a direct correlation between number of hours of TV viewing and academic grade. They collect and compile data to enter on a spreadsheet and create a word processing document supporting their...
Curated OER
Are We Alone
Seventh graders collect/analyze data and draw conclusions; support reasoning by using a variety of evidence; construct logical arguments; access information at remote sites using telecommunications; apply the concept of percent;...
Curated OER
Analysing 2001 Census Microdata
Eighth graders examine the census data of 2001. In this American History lesson, 8th graders analyze data using one- and two-variable statistical analysis. Students develop a research question that makes use of the microdata.
Curated OER
Pulse Rates
Students answer the question, "How will the intensity of exercise effect your heart rate?", using physical workouts and AppleWorks, or similar spreadsheet program. This lesson can conclude with the creation of a graph of data collected.
Curated OER
Why Would I Owe My Soul to the Company Store?
Sixth graders listen to "Sixteen Tons" by Tennessee Ernie Ford and discuss what it means to owe one's soul to a store. In this mathematics lesson, 6th graders determine what a miner's income was minus his expenses graphing findings in a...
Curated OER
Relations and Functions
Students differentiate between a relation and a function. In this algebra lesson plan, students identify a pair of coordinates as being a relation or a function. They analyze graphs for function as they solve word problems.
Curated OER
Equations Lesson Plan
Seventh graders play "What's my Rule" beginning with simple equations and working towards harder problems as student's gain confidence. They evaluate the equations by graphing them. Students identify the slope and y intercepts of the...
Curated OER
Sea and Ice Salinity
Students conduct an experiment. In this salinity lesson, students learn about sea ice, why it is important and how changing amounts can affect the sea. Students conduct an experiment to find out the effects of salinity on the formation...
Texas Instruments
TI-Nspire™ CAS
When it comes to rating educational calculators, this calculator is always near the top of this list. Now it's available as an app. There is a lot of calculator power wrapped up in this app. Not only is this a fully functioning...
Curated OER
What's The Point?
Students solve word problems using the correct math symbols. In this algebra lesson, students use the TI calculator to graph their equation and analyze it. They find the line of regression and use to draw conclusion.
Curated OER
Making a Spreadsheet
Students explore spreadsheet software. In this personal finance and computer technology lesson, students develop a vacation spreadsheet on the computer. Students represent hotel, food, transportation, and entertainment costs on a graph...
Curated OER
Statistics: Misleading or Accurate?
Students explore the concept of misleading statistics. In this misleading statistics lesson, students play a game of tag and graph the number of times each student gets tagged. Students use the graph to determine the fastest runner in...
Curated OER
The Swinging Pendulum
Students observe a pendulum and graph their observation. In this algebra lesson, students use the TI calcualtor to graph the motion the pendulum makes. They analyze the graph and make predictions.


