Curated OER
Texas Regions and Native Americans of Texas
Fourth graders research to find the regions of Texas. In this technology instructional activity, 4th graders create a Kid Pix project showing the location of various regions of Texas. Students show where in those regions Native...
Curated OER
Seasons
Students investigate the reason for seasons on Earth during three activities. They construct a model of the Earth and Sun to identify patterns in the changes of the angle of light on the Earth's surface. Then they conduct a heat...
Curated OER
What's the Matter? (Grade 3)
Third graders organize information about the three types of matter and to reinforce concepts learned in the matter unit of the science curriculum. They use Inspiration software to create a concept map of the three types of matter.
Curated OER
What is a Family?
Students explore how Canadian families have evolved over time. In this census results lesson, students examine the factors that contribute to changing family and household structures. Students also create written and illustrated profiles...
Curated OER
Meeting the Needs of an Aging Population
Learners examine population trends and predict how the age of the majority of Canadians will change 15 years from now in various geographic areas. They will gather statistical evidence that supports their projection. Learners will then...
Curated OER
Friction This
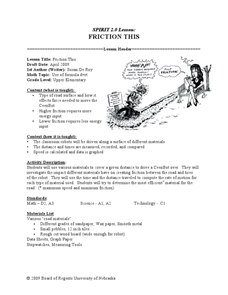
Students investigate road surface and calculate speed. In this algebra instructional activity, students analyze the roughness of a road and calculate distance and speed based on friction. They relate friction and energy to speed.
Curated OER
Probability: Playing With Fire
Students problem solve to find the probability of each tree in a small forest to catch fire. In this probability lesson plan, students use the computer to complete this application.
Curated OER
Historical Figures
Second graders identify a historical figure, his or her societal contributions and basic biography using a Kidspiration graphic organizer and library resources. They use the Internet to conduct an historical treasure hunt in groups.
Curated OER
Animal Research Project
Third graders prepare an oral report using Appleworks to present information on their animal. They write a short narrative comparing and contrasting their animal to another students and, after watching other presentations, discuss what...
Curated OER
Weather
Learners collect daily weather types throughout the school year using a spreadsheet program and Meteorologist freeware in order to predict weather changes and compare seasons. An Appleworks worksheet is included.
Curated OER
Civil War Letter Web
Students use the internet to gather information on a specific Civil War battle of interest to them. Using the information they gather, they organize it into a web to be used later when writing a letter. They use the web to write their...
Curated OER
Angle Pairs
Students practice identifying right, vertical, and adjacent angles using a Smartboard. They then determine measurements of all of the angles when only one measurement is given.
Curated OER
Kidsville USA
Second graders create an imaginary town using Kid Pix. They demonstrate their knowledge of specific vocabulary words and their knowledge and understanding of location by placing schools, stores, parks, etc. appropriately on their maps.
Curated OER
Exploration of Civil War Webquest
Students use the internet to research what life was like for Confederate and Union soldiers in a specific battle of interest to them. In groups, they complete a webquest on the battle in which one represents a Confederate soldier and the...
Curated OER
Creating with Alice
Students explore Alice Programming Software. In this exploratory lesson, students design a unique storyboard which will guide the creation of their Alice World. Students write and create their own films.
Khan Academy
Khan Academy: Representing Graphs
There are several ways to represent graphs, each with its advantages and disadvantages. Some situations, or algorithms that we want to run with graphs as input, call for one representation, and others call for a different representation....
SMART Technologies
Smart: Bar Graphs
This smart note book explains reading bar graphs, the parts of a bar graph, the steps to produce a bar graph and allows classes to input data a produce some bar graphs.
NASA
Nasa: Sea Surface Temperature Trends of the Gulf Stream
Students investigate changes in the surface temperatures of the Gulf Stream over the course of the seasons using data collected by NASA's satellites. The data is inputted into a spreadsheet and graphed.
Beacon Learning Center
Beacon Learning Center: Piece of Pie
This is a tutorial for creating and practice interpreting pie charts. They use the example of number of people in each of 24 families to demonstrate how the pieces of pie are created. Then questions were asked and students input the...
National Council of Teachers of Mathematics
Nctm: Illuminations: Circle Grapher
Use this tool to graph data sets in a circle graph. You can input your own data or alter a pre-made data set.
Illustrative Mathematics
Illustrative Mathematics: 8.f Us Garbage, Version 1
Eighth graders work with input values (the year) and output values (the amount of garbage that year) in a table about the garbage produced in the US. They study the table to answer specific questions, state whether it represents a linear...
National Council of Teachers of Mathematics
Nctm: Illuminations: Circle Grapher
A computer applet that will draw any circle graph with student's data input.
Other
Stat Soft: Statistics Glossary
Dozens of statistical terms are defined and illustrated in this glossary.
National Council of Teachers of Mathematics
Nctm: Illuminations: Bar Grapher
A computer applet that will draw any bar graph with student's data input.


