Curated OER
Conductivity of salt Solutions
Students investigate the concentration level of solutions. In this math/science lesson, students identify three different ionic compounds. They predict the conductivity of each using their collected data.
Curated OER
Modeling Population Growth
Young scholars collect data on population growth. In this statistics instructional activity, students graph their data and make predictions. They find the linear regression and the best fit line.
Curated OER
Let's Graph It!
Students graph the height of others in centimeters and inches, find the slope of line in order to calculate the conversion factor between centimeters and inches.
Curated OER
A Functional Housing Market
Students access the Internet to search for housing prices in Houston, Texas,(the location can be changed to accommodate any location) and compare the prices to the number of square feet found in the living area of a house.
Curated OER
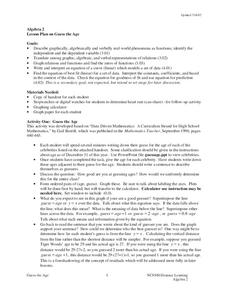
Guess the Age
Students explore functions using real world application. In this algebra lesson, students play a game as they apply concepts of function. They graph their findings and discuss it with the class.
Curated OER
Relating Distance and Velocity Over Time
Students calculate the distance and velocity over time. In this algebra instructional activity, students graph a linear function to represent the distance vers time travel. They interpret their graphs and draw conclusion.
Curated OER
The Swinging Pendulum
Students observe a pendulum and graph their observation. In this algebra instructional activity, students use the TI calcualtor to graph the motion the pendulum makes. They analyze the graph and make predictions.
Alabama Learning Exchange
The Composition of Seawater
Students explore the concept of finding the composition of seawater. In this finding the composition of seawater instructional activity, students make a saturated salt water solution. Students discuss why there is variation...
Curated OER
Guess the Age
Pupils rewrite word problems using symbols. In this algebra instructional activity, students rewrite equations graphically, algebraically and verbally. They relate the concepts to the real world.
Curated OER
Optimization For Breakfast
Students identify he proportion of a cereal box. In this algebra lesson, students define the relationship between patterns, functions and relations. They model their understanding using the cereal box.
Curated OER
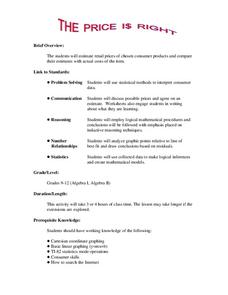
The Price Is Right
Students create a list of products with estimated prices. In this algebra lesson, students learn to write equations using variables. They match their created list with that of actual products and compare their prices,
Texas Education Agency
Texas Gateway: Collecting Data and Making Predictions
Given an experimental situation, the student will write linear functions that provide a reasonable fit to data to estimate the solutions and make predictions.
University of South Florida
Fcat: Shaq's Hand/foot Span: Teacher Notes
Students compare their own hand/foot span to Shaquille O'Neal's, then graph the data & construct a best-fit line. They can then use the information to investigate the proportionality of the human body.
Texas Instruments
Texas Instruments: Linear Functions Modeled by Data
Students submit their own data that can be modeled by a linear function. Students find the line of best fit, and discuss graphs of linear functions.
TeachEngineering
Teach Engineering: The Challenge Question: "Walk the Line"
Students are introduced to the "Walk the Line" challenge question. They are asked to write journal responses to the question and brainstorm what information they need to answer the question. Ideas are shared with the class (or in pairs...
TeachEngineering
Teach Engineering: Walk the Line: A Module on Linear Functions
This module leads students through the process of graphing data and finding a line of best fit while exploring the characteristics of linear equations in algebraic and graphic formats. Then, these topics are connected to real-world...
University of Colorado
University of Colorado: Ph Et Interactive Simulations: Least Squares Regression
Create your own scatter plot or use real-world data and try to fit a line to it. Explore how individual data points affect the correlation coefficient and best-fit line.
Texas Instruments
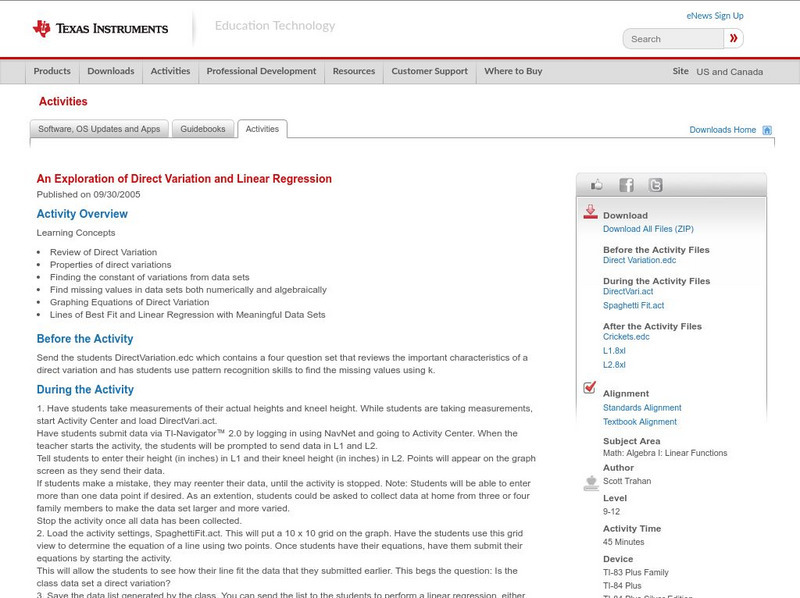
Texas Instruments: An Exploration of Direct Variation and Linear Regression
Students will use this activity for the following Algebra concepts: Review of Direct Variation; Properties of direct variations; Finding the constant of variations from data sets; Find missing values in data sets both numerically and...
Physics Aviary
Physics Aviary: Quick Graph 3.0
This program was designed as a quick graphing program that students could use on a computer, tablet or smart phone when a more complex graphing program is not available. This program will let students plot up to 10 data points and then...
Texas Instruments
Texas Instruments: A Sweet Drink Adventure 7
Students determine how the temperature of water affects the dissolving time of a sugar cube. They create, interpret and analyze graphs of data, find an equation of the line of best fit, and relate slope to rate of change.
Texas Instruments
Texas Instruments: A Wet Welcome Home Adventure 4
Students perform an experiment that simulates a leaking pipe and gather data on volume of water lost over time. They graph the data collected as a scatter plot, find the equation of the line of best fit, find the total volume of water...
Texas Instruments
Texas Instruments: What Is a Linear Regression?
In this activity, students create lists of data points, plot them on a graph, and determine the regression equation of the best fitting line. They also understand exactly how the linear regression is determined.
Rice University
Rice University: The Hand Squeeze
Students will enjoy this data collection and class analysis experiment involving the time it takes for a hand squeeze to travel around a circle of people. From organizing the activity to collecting the data to making a table and graphing...
Texas Instruments
Texas Instruments: Numb3 Rs: Less Is More
Based off of the hit television show NUMB3RS, this two-part lesson begins by having students try to find the line of best fit for a given set of data (strike outs vs. home runs). The second part of the lesson shows how least squares...


