EngageNY
Multi-Step Problems in the Real World
Connect graphs, equations, and tables for real-world problems. Young mathematicians analyze relationships to identify independent and dependent variables. These identifications help create tables and graphs for each situation.
Howard County Schools
Drawing Inverses
An Algebra II lesson draws the connection between the exponential function and its inverse. By graphing an exponential function and using tables and a calculator, students graph the logarithmic function. The plan comes with a...
UAF Geophysical Institute
Carbon Footprint
Your young environmentalists can calculate their carbon footprint and discuss ways to reduce it with a worksheet about climate change. After reading a handout about what impact one's carbon footprint can have on the environment, kids...
Curated OER
Mathematics: A Picture's Worth a Thousand Words
Students examine school yearbooks from 1950 to the present. They count the number of male and female teachers and administrators. They compile date and extrapolate changes in job trends.
EngageNY
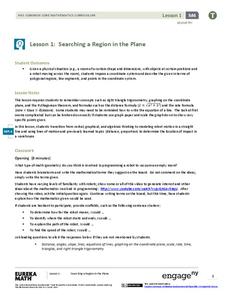
Searching a Region in the Plane
Programming a robot is a mathematical task! The activity asks learners to examine the process of programming a robot to vacuum a room. They use a coordinate plane to model the room, write equations to represent movement, determine the...
Georgia Department of Education
Math Class
Young analysts use real (provided) data from a class's test scores to practice using statistical tools. Not only do learners calculate measures of center and spread (including mean, median, deviation, and IQ range), but...
Curated OER
Algebra 1: Slope as Rate
Students solve problems with slopes. In this algebra lesson, students identify the slope of a line and relate it to the rate of change. They graph their lines on the TI and observe changes in the lines.
Utah Education Network (UEN)
The Pasture and the Fence
Beginning geometers use tiles and grid paper to draw and calculate perimeter and area. Rectangles of different sizes are created and then measured to build understanding. The one-inch grid sheet referenced is attached.
Curated OER
Range, Cluster, Gap and Outliers
There are a number of activities here where learners collect and record data, as well as, activities where the likelihood of an event happening is calculated given the experimental probability. Young statisticians organize information...
Curated OER
Influence and Outliers
Using the TI-Nspire calculator, statisicians identify outliers and their effect on the least-squares regression line. In finding the line of best fit, they determine what points will affect the least squares regressions and what points...
Virginia Department of Education
Transformationally Speaking
Young mathematicians explore transformations of graphs by graphing sets of functions on the same pair of axes. They use their graphs to determine the effect that the values of a and b in y = ax + b have on the graph of y = x.
Curated OER
Linear Piecewise Functions
Students explore the concept of piecewise functions. In this piecewise functions lesson, students graph piecewise functions by hand and find the domain and range. Students make tables of values given a piecewise function. Students write...
Curated OER
The Way to Better Grades!
Pupils collect and analyze data. For this statistics lesson, learners create a scatter plot from their collected data. They use, tables and graphs to analyze the data and mae decisions.
Curated OER
Linear Inequalities in One and Two Variables: Rays and Half Planes
Define rays and half planes, including the concepts of boundary lines and prerequisite knowledge of coordinate planes. Given linear inequalities in one and two variables, your class will compare the differences. They will also graph...
Curated OER
The Race of Baseball All-Stars
Collect and analyze data. Pupils graph their data and model with it to solve real life problems. They use logic and deductive reasoning to draw conclusions.
Curated OER
How Deep Do They Dive
Pupils calculate and graph the diving depths of various types of whales. They cut out and glue whale pictures on a worksheet to represent the diving depths for five whales, and discuss how people use graphs to communicate.
Curated OER
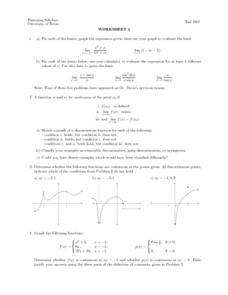
Worksheet 4: Limits
In this limits worksheet, students evaluate limits and graph given expressions. They classify graphs as removable discontinuities, jump discontinuities, or asymptotes. this two-page worksheet contains seven multi-step problems.
Curated OER
Is the Rainbow Fair?
Third graders perform statistical calculations. Given a bag of Skittles, 3rd graders sort and collect data regarding the colors included in their bag. Using spreadsheet software, students create a bar graph of the information collected....
Curated OER
Virtual Field Trip
This hands-on resource has future trip planners analyze graphs of mileage, gasoline costs, and travel time on different routes. While this was originally designed for a problem-solving exercise using a Michigan map, it could be used as a...
Curated OER
Worksheet 13 - Derivative
In this derivative of a power worksheet, students compare derivatives of functions, and graph functions. This one-page worksheet contains five multi-step problems.
Curated OER
Tune...Um!
High schoolers collect real data on sound. In this algebra lesson plan, students use a CBL and graphing calculator to observe the graph created by sound waves. They draw conclusion about the frequency of sound from the graph.
Curated OER
Lines of Best Fit
Students determine if there is an associationm in a scatter plot of data. They analyze data through predictios, comparisons, and applications. Students calculate the line of best fit using a graphing calculator. They display data in...
Curated OER
Why Doesn't My New Shirt Fit?
Students test Leonardo da Vinci's view of the human body by measuring various body parts using a tape measure. They create a data table and a scatter plot and then analyze and interpret the results using a graphing calculator.
Curated OER
Graphing Absolute value Inequalities
High schoolers investigate the concept of inequalities and practice graphing them at various degrees of difficulty. They review the basic rules with the teacher at the level of theory which may make it harder for them to understand...
Other popular searches
- Graphing Calculator and Math
- Algebra Graphing Calculators
- Graphing Calculator Math
- Graphing Calculator Skills
- Graphing Calculator Squares
- Graphing Calculator Lessons
- Graphing Calculator Parabola
- Graphing Calculators Ti 83
- Graphing Calculator Activities
- Graphing Calculator Worksheet
- Ti 84 Graphing Calculator


