Curated OER
Hopes and Dreams: A Spreadsheet Lesson Using Excel
Fourth graders read "The Far Away Drawer" by Harriet Diller and discuss the story as a class. After discussion, 4th graders create a t-shirt GLYPH about their hopes and dreams,share their information with the class and create spreadsheets.
Curated OER
Walking Home
Students discover the formulas for calculating distance. In groups, they solve equations determine the distance in a specific amount of time. They record their answers in a chart or graph and compare them with their classmates.
Curated OER
Walking the Plank
Eighth graders experiment with a bathroom scale, books and a plank to determine how weight readings change as distance is applied. They graph and interpret the results.
Curated OER
Reaching New Heights
Students explore the relationship between two variables. Students measure their arm span and height. They gather this class data to design a scatter plot. Students interpret the meaning of individual coordinates and the overall graph....
Curated OER
Mystery Liquids: Linear Function
High schoolers determine the linear equations of the density of water and oil by collecting data on the mass of various volumes of each liquid. They construct scatter plots from the data and use these to write the linear equations for...
Curated OER
Instantaneous Rate of Change of a Function
Pupils draw the graph of a door opening and closing over time. They graph a given function on their calculators, create a table of values and interpret the results by telling if the door is opening or closing and evaluate the average...
Curated OER
Intercepting Villans Using the Correct Rate
A Cyberchase video introduces the distance = rate x time equation. Participants then calculate answers to proposed problems and graph a series of results that is then incorporated into a game to help cement the concept. A thorough and...
Curated OER
The Square Counting Shortcut
An excellent lesson plan that encourages students to discover how complex figures can be broken into simpler shapes when measuring area. Working with block letters, learners are given the freedom to develop their own strategies for...
Curated OER
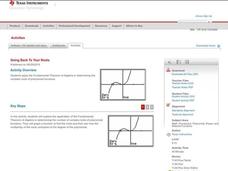
Going Back to Your Roots
Who doesn't need to know the Fundamental Theorem of Algebra? Use the theorem to find the roots of a polynomial on a TI calculator. The class explores polynomials with one solution, no real solutions, and two solutions. This less lesson...
Curated OER
The Candy Color Caper
Young scholars explore the concept of probability. They calculate the probability of an event happening and graph their results. Students determine the probability of winning a sweepstakes. They construct a bar graph to represent all the...
Curated OER
Visualizing Vectors
Investigate vectors in standard positions and use the CellSheet application on the TI calculator to find the sum of two vectors. Convert from polar to rectangular coordinates and vice versa, and show graphs of the vectors.
Curated OER
Linear Programming
Students explore inequalities to determine the optimal solution to maximize a profit for a company. In this linear programming lesson plan, students discover how to graph inequalities and how to determine the algebraic representation of...
Curated OER
Investigation Designing a Patchwork Quilt
Fourth graders practice calculating area by creating a classroom quilt. Students are given a 6x6 inch square material they design based on a classroom theme. A sample of the class quilt is created using graph paper so students may...
Curated OER
Linear Inequalities in Two Variables
Graph and solve linear equations in two variables. The class relates the concepts of linear equations to the real world.
Council for Economic Education
Production Possibilities Curve
Demonstrate the important economic principles of the production possibilities curve, including how to calculate opportunity cost and graph curves by using a table or calculation. Learners use a variety of methods, including videos,...
Curated OER
TE Activity: A Tornado in My State?
Students study data about tornadoes in the United States while completing a worksheet. They develop a bar graph showing the number of tornadoes for the top ten states in the US. They find the median and mode of the data set.
Curated OER
Matrix Madness!!
Perform operations to add, subtract, multiply and divide matrices. Then solve problems with vectors using matrices. A three day lesson: Matrix Madness, Mystical Matrices, and Decode the Encode. The last lesson has prizes that the class...
National Security Agency
Partying with Proportions and Percents
Examine ratios and proportions in several real-world scenarios. Children will calculate unit rates, work with proportions and percentages as they plan a party, purchase produce, and take a tally. This lesson plan recommends five...
Curated OER
Residential Power System
Perform data analysis on energy consumption to apply algebraic expressions to the real world. Learners will write and solve equations that answer various questions from residential power use. They will collect data at home and calculate...
Curated OER
Linear Inequalities
Through exploration of linear programming through graphs and equations of inequalities, students relate linear programming to real life scenarios, such as business. Graphing and shading is also part of this exercise.
Cornell University
Math Is Malleable?
Learn about polymers while playing with shrinky dinks. Young scholars create a shrinky dink design, bake it, and then record the area, volume, and thickness over time. They model the data using a graph and highlight the key features of...
Curated OER
Linear Functions
Your learners will explore linear functions by analyzing a graph of the linear equations.Then learners analyze through calculating f(x+P) and g(x+p)
Curated OER
Metrically Me!
Students define the parts of a database, search strategies to locate information electronically, create/modify databases, etc. and enter data into a prepared spreadsheet to perform calculations.
Curated OER
Acceleration Lab
Young Einsteins experiment with the acceleration of Hot Wheels™ toy cars down inclined planes at various angles. This classic physics lab activity is thoroughly explained in both a teacher’s guide and a student lab sheet. Science...
Other popular searches
- Graphing Calculator and Math
- Algebra Graphing Calculators
- Graphing Calculator Math
- Graphing Calculator Skills
- Graphing Calculator Squares
- Graphing Calculator Lessons
- Graphing Calculator Parabola
- Graphing Calculators Ti 83
- Graphing Calculator Activities
- Graphing Calculator Worksheet
- Ti 84 Graphing Calculator


