EngageNY
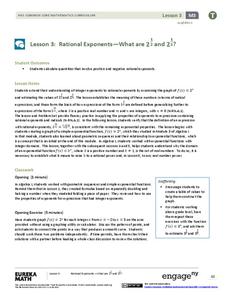
Rational Exponents—What are 2^1/2 and 2^1/3?
Are you rooting for your high schoolers to learn about rational exponents? In the third installment of a 35-part module, pupils first learn the meaning of 2^(1/n) by estimating values on the graph of y = 2^x and by using algebraic...
Teach Engineering
Can You Resist This?
Some things are hard to resist. Small collaborative groups build circuits and calculate the voltage using Ohm's Law. Budding engineers explore the connection between the voltage across different resistors and linear...
Statistics Education Web
When 95% Accurate Isn’t
Investigate the effect of false positives on probability calculation with an activity that asks scholars to collect simulated data generated by a calculator. To finish, participants analyze the probability of certain outcomes which lead...
EngageNY
Building Logarithmic Tables
Thank goodness we have calculators to compute logarithms. Pupils use calculators to create logarithmic tables to estimate values and use these tables to discover patterns (properties). The second half of the lesson has scholars use given...
Curated OER
Drawing to Scale
Students examine the process of drawing a picture to scale. They analyze and discuss real-life blueprints for a house, and create a scale drawing of an original invention using calculators and rulers.
Curated OER
Buying on Credit
Explore using credit in this financial responsibility and math instructional activity. Learn to identify the acronym of "PRT" as Principle x Rate x Time, then calculate interest based on this formula. Do some real-world problem solving...
Curated OER
Newton's Law of Cooling
Your Algebra learners analyze and solve an exponential equation in this popular, real-life model of the cooling of a liquid.
Curated OER
Dragonfly
The speed of a dragonfly brings math into the real world as your learners collaboratively see the value in calculating unit rates in direct proportion problems. This six-phase lesson encourages you, as the teacher, to only ask questions...
West Contra Costa Unified School District
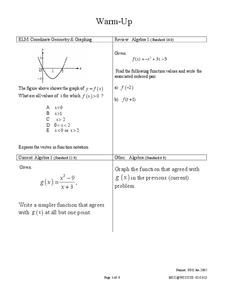
Derivative – Standard Definition
Making a clear connection to algebra concepts helps learners understand the definition of a derivative. The lesson begins with looking at limits of simple linear and rational functions, and leads to the definition of the...
EngageNY
Modeling a Context from a Verbal Description (part 2)
I got a different answer, are they both correct? While working through modeling problems interpreting graphs, the question of precision is brought into the discussion. Problems are presented in which a precise answer is needed and...
Virginia Department of Education
Surface Area of a Rectangular Prism
Wrap up a lesson on surface area with a resource that asks scholars to use the idea of wrapping paper to investigate surface area. They draw representations of rectangular prisms on graph paper to find the areas of the respective...
Curated OER
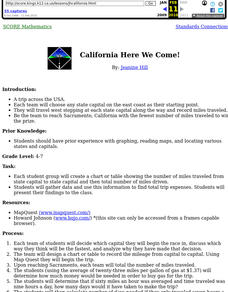
California Here We Come!
A highly relevant and great cross-curricular project! In teams, your class will plot a course from the East Coast to Sacramento, California passing through all of the state capital cities along the way. As part of the journey, teams...
Curated OER
As a Matter of Fact
Elementary-aged scientists discover that all matter has mass. They are shown the difference between mass and weight, and learn how to calculate mass using the appropriate tools and methods. The scientific method is used while estimating...
Curated OER
Photosynthesis
Students conduct experiments with plants. In this photosynthesis lesson, students examine plants under different types of lights. They calculate the amount of dissolved ocygen concentration and compare it to the formula for...
Curated OER
Completing the Square
Solve equations by completing the square. The pupils factor quadratic equations and graph the parabola. They also identify the different terms in the equation and look for patterns.
Curated OER
Household Conservation/Efficiency
Hook your class up to an online home energy usage calculator so that they can estimate the amount used per month by their families. Then give them Watt meters with which they will measure the power consumption of several small...
American Statistical Association
An A-MAZE-ING Comparison
Teach your class how to use descriptive statistics through a hands-on data collection activity. Pupils collect their own data, calculate test statistics, and interpret the results in context. They compare male and female results, looking...
EngageNY
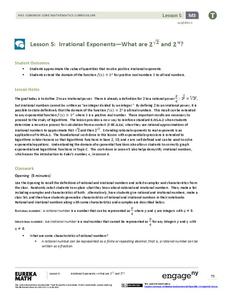
Irrational Exponents—What are 2^√2 and 2^π?
Extend the concept of exponents to irrational numbers. In the fifth installment of a 35-part module, individuals use calculators and rational exponents to estimate the values of 2^(sqrt(2)) and 2^(pi). The final goal is to show that the...
Bowland
Explorers – Patrol Services
Far out — plan a trip to space! Aspiring mathematicians steer a space vehicle through an asteroid field, calculate currency exchanges to buy provisions, and determine placement of charges to blow up asteroids. Along the way, they learn...
Statistics Education Web
The United States of Obesity
Mississippi has both the highest obesity and poverty rate in the US. Does the rest of the data show a correlation between the poverty and obesity rate in a state? Learners tackle this question as they practice their skills of regression....
Beyond Benign
Product Test
It's the moment of truth. Previous lessons in the 24-part series had scholars design and develop shampoo formulas using chemical concepts. The 18th lesson asks them to test the function of their shampoos. To do this, they calculate the...
Curated OER
Introduction to Flight: A Math, Science and Technology Integrated Project
Seventh graders review graphing procedures and practice locating points using x,y coordinates. Students calculate the areas of the top and bottom surfaces of the airfoil. They construct a test model of the airfoil.
Curated OER
Human Population- Changes in Survival Rates Data Interpretation
In this human population changes in survival worksheet, students interpret and plot data to understand the differences in human mortality and survivorship between historic and modern times. They investigate how these changes influence...
Curated OER
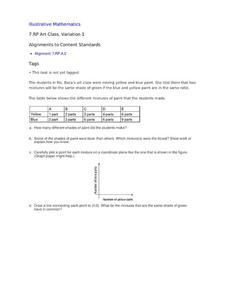
Art Class, Variation 1
Student statisticians calculate ratios to determine how many shades of green were mixed by Ms. Baca's art class. They graph the number of blue parts against the number of yellow parts for each combination and discover that some produce...
Other popular searches
- Graphing Calculator and Math
- Algebra Graphing Calculators
- Graphing Calculator Math
- Graphing Calculator Skills
- Graphing Calculator Squares
- Graphing Calculator Lessons
- Graphing Calculator Parabola
- Graphing Calculators Ti 83
- Graphing Calculator Activities
- Graphing Calculator Worksheet
- Ti 84 Graphing Calculator


