Curated OER
"You're Hired!'
Students investigate linear programming using the TI. For this algebra lesson, students collaborate and graph linear inequalities on a TI. They analyze their data and present it to the class.
Curated OER
Does Sunlight Effect Leaf Size?
Students make estimates and then measure leaves for accuracy. They calculate the area of the leaves by drawing an outline on graph paper and counting the squares. They compare the leaves exposed to sunlight to those that are in constant...
Curated OER
Fun with Math using Magnetic Force
Sixth graders explore and discuss the effectiveness of magnets in different situations. For this math lesson, 6th graders discuss rate and graphs after exploring with magnets using different restrictions on the magnets. They analyze...
Curated OER
Antarctica’s Melting and the Affect it has on the Ocean
High schoolers calculate how much mass is lost and gained by Antarctica yearly. In this earth science lesson, students graph and analyze data from the given handout. They explain how this affects the world climate.
Curated OER
Translate Word Phrases and Sentences into Equations
Use this video to show your learners an example of how to translate word phrases into an equation to solve a real-world problem. The presenter begins with a review of how to use cross products to solve a proportion, including how to do...
Curated OER
Data Analysis of Ground Level Ozone
Sixth graders construct and interpret graphs from ozone data collected in Phoenix area. Can be adapted to other areas.
Curated OER
Turn Up the Volume
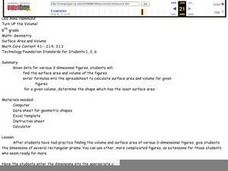
Measuring volume can be a mystery for 5th graders, but this hands-on activity gives the gift of discovery. The volume of simple rectangular solids and irregular shapes are calculated through various methods including displacing liquid in...
Curated OER
Stick-Slip Movement
Ninth graders operate a model to observe the type of motion that occurs at a fault during an earthquake. They explore the effects of several variables. Students measure movement, calculate averages and plot and graph information.
Curated OER
Investigation- What Does It Cost?
Eighth graders investigate percents by comparing different discounts on the same sale item, practice graphing percents, and look at reasonable and unreasonable "percents off" a sale item.
Curated OER
Capture/Recapture
Students use proportions to estimate the size of populations. They describe the data with using a graph or table of the estimate. Students use descriptive statistics to calculate mean, median, and mode. They also compare and contrast an...
Curated OER
Fishing for Points
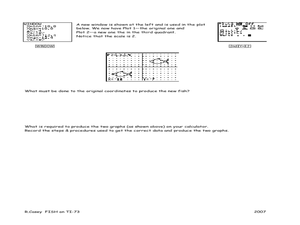
Learners explore the concept of ordered pairs. In this ordered pairs lesson, pupils list the ordered pairs of a graph in the shape of a fish. They use their calculator to translate the fish using lists, then translate the fish left,...
Curated OER
Discovering Ohm's Law
Connect math with science! Pupils apply properties of Ohms Law as they solve problems and identify the inverse relationship of a function. They analyze the shape of the graph of an inverse function and use it to make predictions.
Curated OER
Take Your Medicine 2
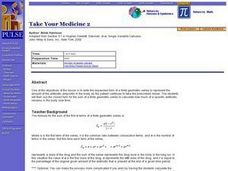
Real-world application of the finite geometric series. Sick? Need to take Ampicillin? How much is in the body at any given point in time as this medication is taken over the course of time. Use the formulas, make calculation, and graph...
Curated OER
Annual Wetland Plant Diversity Survey
Students locate an area of marsh and, by measuring the total number of individual plants in a sample area, determine whether purple loosestrife population density is correlated to the total plant diversity of the community. They...
Curated OER
Excel Lesson
Students explore data and Excel spreadsheets. They collect data about political candidates. Students enter the data into a chart on Excel. They create a graph using the data and Excel.
Curated OER
Types of Functions and Composition of Functions
Algebra II classes solve problems relating to piecewise functions, step functions, and decomposition/composition of functions. They utilize links to work with real world examples. Mr. Pleacher has added humor to the lesson by including...
Curated OER
Buying a Car
Eighth graders create spreadsheets to calculate payments. They create a list of items they would like to purchase that require monthly payments. They simulate buying a car and create a spreadsheet to determine the amount of the monthly...
Curated OER
Count on Me
Fourth graders use inductive reasoning to find algebraic patterns in geometric figures. They use technology (i.e., calculators, computers) and manipulatives to discover number patterns involving geometric concepts. They solve concrete...
Curated OER
Penny Pushing
Fifth graders use an Excel spreadsheet to show them how to enter the amount of pennies they bring each week to school for a fundraising project. They count their pennies each Friday and enter the total amount in the correct columns. In...
Curated OER
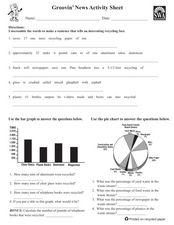
Groovin' News Activity Sheet
In these recycling worksheets, students complete several activities to learn about recycling. Students complete a word search, word scramble, bar graph, pie chart, research project, class project, and individual project for recycling.
Curated OER
Two-Variable Linear Inequalities
Here is an engaging lesson on solving equations with two variables. Have the class rewrite linear equations in the slope intercept form, y=mx + b. They graph the lines using the slope and y-intercepts.
Curated OER
The Air Up There
Learners observe the weather over a period of two weeks. They gather local weather data and calculate the mean and average figures from the data. They prepare a graph with their observations.
Curated OER
A Look At Rocks
Students write letters to organizations, such as United States Geological Society, to find out more about rocks. Students write about a pretend time they found a magic pebble. Students calculate distances to travel to see various...
Curated OER
See Turtles Nest! See Turtles Hatch!
Students graph data of sea turtles hatching rates from Watamu/Malindi Marine National Park and Reserve in Kenya. In this math lesson, students use real life science data to calculate mean and median values. Students use...
Other popular searches
- Graphing Calculator and Math
- Algebra Graphing Calculators
- Graphing Calculator Math
- Graphing Calculator Skills
- Graphing Calculator Squares
- Graphing Calculator Lessons
- Graphing Calculator Parabola
- Graphing Calculators Ti 83
- Graphing Calculator Activities
- Graphing Calculator Worksheet
- Ti 84 Graphing Calculator


