Curated OER
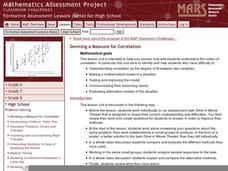
Devising a Measure for Correlation
How well does your class understand the concept of correlation? Use an activity to explore different methods of calculating correlation. Working alone and then in groups, your class will make decisions on what math to apply to the...
Curated OER
From There To Here...
Students find out where some of the products in hour homes come from, then become aware of our local trash, landfills and incinerators. They chart and graph data and use maps for different purposes.
Curated OER
Frame Yourself
Young ratio masters calculate and cut a frame (out of poster board) to accurately create an even frame around a picture of themselves. The frame needs to be proportional to the picture with constraints determined by the instructor.
Curated OER
Old Glory
Students utilize mathematical concepts such as: measurement, ratio and proportion and geometric probability to analyze the components of the U.S. Flag. They collect, organize and interpret data by constructing charts, tables and graphs...
Curated OER
All About Me: Measuring Height and Weight
Learners take personal fitness inventories. In this personal health lesson, students take measurements of their heights and weights. Learners record the data, calculate their BMI, and then chart their physical activity.
WindWise Education
What Factors Influence Offshore Wind?
What is that out in the water on the horizon? Teams work together to study the coastline using maps to determine the best and worst locations to place an offshore wind farm. The teams then build a scale model wind farm to see what it...
Curated OER
What Are You Eating?
Discover the calorie content of foods by observing how much heat they produce in water. If you have a calculator-based laboratory (CBL™) insturment for collecting data, then this laboratory worksheet will not need any changes. If...
Curated OER
Louisville's Best Field Day Park
Students create a survey to hand out to determine the best field day park. Using their local area, they select five parks, if possible, that meet the criteria and calculate the distance and estimated time travel. They use this...
Curated OER
Reading & Using a Nutrition Label
Students discover the importance of healthy eating. Using food nutrition labels, they read and examine the nutritional value. Students collect the data on a spreadsheet and create a graph. They analyze the media influences on product...
Curated OER
Worksheet 27 - Functions
In this function worksheet, students sketch the graph of a nonzero function, estimate the value of an infinite sum, and determine the derivative and slope of functions. This one-page worksheet contains approximately 6 multi-step problems.
Curated OER
Worksheet 13-Fall 1995
In this math worksheet, students find the domain and range of trigonometric functions. They estimate the limit of a given function. Students identify three statements about one to one functions as true or false. They solve for k in two...
Illustrative Mathematics
Irrational Numbers on the Number Line
There are four irrational numbers that participants need to graph. Pi(π), -(½ x π), and √17 are easy to approximate with common rational numbers. On the other hand, the commentary describing the irrational number 2√2 is not...
Curated OER
Our Favorites
Learners participate in and conduct a survey to determine various class favorites. They collect, organize and display their data, interpret the results, and complete a packet of worksheets to display the information.
Curated OER
Marvelous Mathematics
Learners make a table on the computer, but create fractions and equivalent fractions through the use of color. They are able to manipulate fractions in order to gain a greater understanding of the meaning of whole number that is broken...
Curated OER
Collecting And Organizing Data
In this collecting and organizing data worksheet, students, with a partner, problem solve and calculate the answers to six mathematical word problems.
Curated OER
Exploding Numbers
Students discuss how numbers increase when exponential growth is occurring. They view a video and compare exponential and linear growth with a graphing calculator.
Curated OER
Visual Representation of Reduced Fat
Students demonstrate their understanding of the Five-Number Summary and Box-Plots by analyzing different nutrition labels from regular and reduced fat items using graphing calculators.
Curated OER
Linear Progression
Students use graphing calculators to graph lines and create tables of values. They perform an experiment using M&M's and slinkys, then create their tables based on their results.
Curated OER
The Cricket and The Plant
Students examine determine the symbiotic relationship between plants and animals as the find ways to naturally reduce carbon dioxide emissions. They study the carbon cycle. They work with probe and graphing calculator to examine the...
Curated OER
Chaos and Fractal Applications
Eighth graders identify the different applications of fractals. In this math lesson plan, 8th graders use graphing calculator to solve algorithms. They explain how changing parameters and initial conditions affect the solutions.
Curated OER
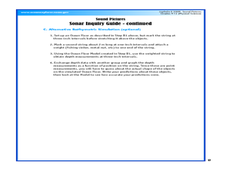
Sound Pictures
Students examine the components of a sonar system. In this physical science instructional activity students explain how multibeam and sidescan sonar systems are useful to ocean explorers. Students simulate sonar operations in an...
Curated OER
Lift vs. Airspeed
Students, after reading the explanation given below, use FoilSim and a graphing calculator to complete the activity to determine the relationship between airspeed and lift of an object by interpreting data.
Curated OER
Bacteria Buddies
Tenth graders grow two different bacteria cultures. They count the colonies, and then use graphing calculators to predict the number of colonies that are going to appear. Students answer questions from their worksheet after completing...
Curated OER
Lift/Velocity Relationship Problem Set
Students, after reading an explanation from a NASA Web-based textbook, demonstrate their ability to use, graph (using a graphing calculator), and interpret a text equation.
Other popular searches
- Graphing Calculator and Math
- Algebra Graphing Calculators
- Graphing Calculator Math
- Graphing Calculator Skills
- Graphing Calculator Squares
- Graphing Calculator Lessons
- Graphing Calculator Parabola
- Graphing Calculators Ti 83
- Graphing Calculator Activities
- Graphing Calculator Worksheet
- Ti 84 Graphing Calculator


