Curated OER
T-Shirt Lettering
Students determine the cost of a t-shirt using a variety of mathematical operations to solve problems. Then they use a spreadsheet to calculate the cost of lettering a t-shirt and display this information in a graph.
Curated OER
New Kids in The Hall
Students assess the role of statistics in determining those athletes chosen to be inducted into the Baseball Hall of Fame. They work in small groups to calculate, chart, and graph various statistics for different Hall of Fame members.
Curated OER
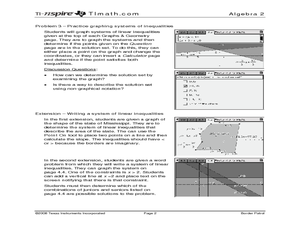
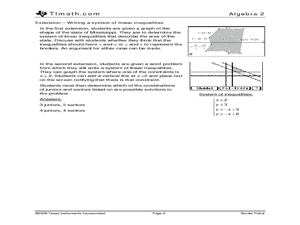
Border Patrol ID: 11603
Incorporate technology in your classroom by teaching your learners how to graph systems of linear inequalities as they apply to an area of land. The lesson plan provides an extension in which students are challenged to write a...
Curated OER
TI-Nspire Activity: What Does Your Representation Tell You?
By learning to select the best representation for three meal plans, students compare three meal plans to determine the best choice. Data for the meal plans is sorted on a table, as an algebraic equation, and graphed on a coordinate grid....
Curated OER
Derivative Analysis
Students analyze the derivative of a graph. In this calculus lesson, students identify the different behavior of a graph. They label concavity of the graphs as increasing or decreasing.
Curated OER
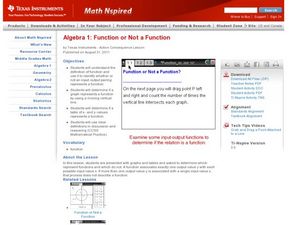
Function or Not a Function
Graphing linear equations on the TI is easy! Through examination of graphs and identification if it is a function or not, this instructional activity can relate to the real world.
Curated OER
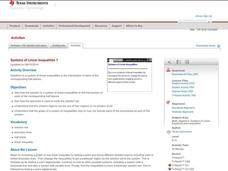
Systems of Linear Inequalities
The class solves systems of linear inequalities. They graph lines and identify the point of intersection.They graph lines and identify the boundary that represent the solution and solution set.
Curated OER
TI-89 Activities for PreCalculus and AP Calculus
Using the TI-89 calculator, high schoolers explore the statistical, graphical and symbolic capabilities of the TI-89. Students investigate topics such as solving systems of equations, finding inverse functions, summations,...
Curated OER
Michigan Virtual Field Trip
Learners analyze data from a virtual field trip to Michigan. They conduct Internet research on mileage and travel time between cities, calculate and compare fuel costs, and research and calculate lodging, activities, and meal costs.
Curated OER
Music Favorites and Place Value
Fourth graders view CD ads and create a chart about an imaginary CD purchase. In this CD lesson, 4th graders calculate various cost connected with the CD's at the regular price and on sale. Students write a paragraph about the...
Curated OER
Animal Skin
Students investigate the skin surface to body area ratios for different animals. In this seventh/eighth grade mathematics/science lesson, students explore heat transfer between an animal’s body and the environment. Using...
Curated OER
Slow Down - Speed Up
Pupils explore the concept of distance and time as they use a CBR to mimic distance v. time graphs. Learners walk towards and away from the monitor to create various distance v. time graphs, then discuss what motion creates certain graphs.
Curated OER
Approaching Limits
With the assistance of their Ti-84/Ti-83 Plus calculators, students develop a foundation for the limiting process as well as estimate limits from graphs and tables of values. They view how a function behaves as the input approaches a...
Curated OER
Deer: Predation or Starvation
In this predation or starvation worksheet, students read about the effects of the wildlife service bringing in predators (wolves) to control a deer population. Students calculate the change in the deer population from 1971 to 1980. They...
Alabama Learning Exchange
Poppin' For Popcorn!
Students graph data from different popcorn flavors. In this graphing lesson, students make graphs using an assigned web site after collecting data about the flavors of popcorn that fellow classmates prefer.
Curated OER
Percents: (An Application to Real Life Problems)
Seventh graders explore the concept of calculating percents. In this calculating percents lesson, 7th graders simulate ordering food off of a menu. Students work in groups to calculate the bill, tax, and the tip for the...
Curated OER
Mean, Median, Mode and Range
Fourth graders investigate when to find the mean, median, mode and range. In this statistical concepts lesson, 4th graders collect data, make observations and graph the data. Students verify their work on the computer.
Curated OER
Border Patrol
Young scholars investigate systems of linear inequalities as they apply to an area of land. They practice graphing systems and determine if a point lies in the solution.
Curated OER
Sequence Investigation
Eleventh graders investigate arithmetic sequences. In this Algebra II activity, 11th graders create an arithmetic sequence and explore the effect of each variable in the formula of the nth term of an arithmetic sequence. ...
Curated OER
Conic Sections
Students explore the different properties of conics. In this algebra lesson, students calculate the midpoint of a line, the distances between two points as they get ready to find the focus and directrix in eclipse and other conics. They...
Curated OER
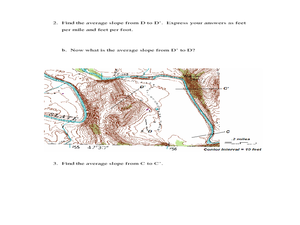
Slope and Topographic Maps
Learners investigate slopes as they study topographic maps. In this algebra lesson, students discuss and apply the concept of slopes to graphing and analyzing data.
Curated OER
Local Linearity
In order to investigate local linearity, students graph the function on the TI-calculator and zoom to observe the change in slope on the line. They incorporate technology to visualize these problems.
Texas Instruments
Continuity and Differentiability 1
Pupils examine graphs for continuity and differentiability in this calculus lesson. They observe piecewise functions to see where continuity and differentiability come into play. Learners finish by graphing their equation on the TI...
Curated OER
Riemann Rectangle Errors
High schoolers calculate the area under a curve. In this calculus lesson, students integrate the function to find the area under the curve. They use the Ti to create a visual of the graph.
Other popular searches
- Graphing Calculator and Math
- Algebra Graphing Calculators
- Graphing Calculator Math
- Graphing Calculator Skills
- Graphing Calculator Squares
- Graphing Calculator Lessons
- Graphing Calculator Parabola
- Graphing Calculators Ti 83
- Graphing Calculator Activities
- Graphing Calculator Worksheet
- Ti 84 Graphing Calculator


