Curated OER
Piecewise Linear Integral
Young mathematicians solve and graph piecewise functions in this calculus lesson. They integrate linear functions containing restrictions and graph their answers using the TI.
Curated OER
Exponential Functions and the Natural Logarithm
Students solve exponential and log functions. For this algebra lesson, students graph natural log and logarithmic functions. They compare and contrast between logs and the exponential graphs.
Curated OER
Cell Phone Range
Here is a 15 minute activity that can be used as review, a warm, or as a quick example of how to relate functions to the real world. Learners complete an application activity and draw conclusion about functions then discuss open and...
Curated OER
Comparing Linear and Exponential Functions
Teach your class how to differentiate between linear and exponential functions. They use exponential properties to solve problems, graph them using the TI-Navigator, and make comparisons.
Curated OER
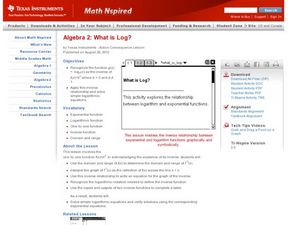
What is Log?
Young mathematicians differentiate between logs and natural logs in this algebra lesson. They solve functions and logarithmic functions. Learners also graph and rewrite the exponential and log functions.
Curated OER
Solving Logarithmic Equations
High schoolers solve logarithmic equations. They graph and plot logarithmic functions and use algebraic steps and the calculator to simplify and solve the equations.
Curated OER
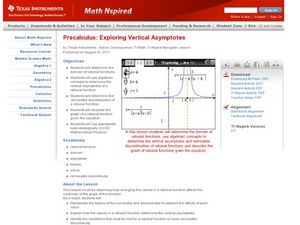
Exploring Vertical Asymptotes
Scholars identify the domain of a rational function in this precalculus lesson. They identify the removable discontinuity and label what will make the denominator zero. Learners also describe properties of the graph as it relates to the...
Curated OER
What Are My Chances?
Students calculate probability. In this lesson on probability, students use given data to calculate to chances of a given event occurring. Many of the calculations in this lesson are applicable to daily life.
Curated OER
Surfing the Waves
Students use online resources, including animations,to define the slope of a curve and how to calculate the slope. They solve 8 problems online, using the definition of the derivative of a function at a point to calculate slope of the...
Curated OER
Power Function Inverses
Pupils graph polynomial functions and analyze the graphs. They identify the inverse of the functions and find the domain and range. Learners will then label the functions as one to one and use the horizontal and vertical line test to...
Curated OER
Analyzing Equations Through Slope and Y intercepts
Students analyze equations using the slopes and intercept. In this algebra lesson, students graph equations give the slope and y intercepts. They are also asked to identify the slope and y intercept from a given graph. They solve real...
Curated OER
Analyzing Equations Through Slope and Y intercept
Students analyze equations using the slope and y-intercept. In this algebra activity, students identify the slope using a and the intercept using m. They graph linear equations based on the slope and intercept.
Curated OER
The Demographics of Immigration: Using United States Census Data
High schoolers work together to analyze United States Census data on immigration. They compare and contrast the data and determine how immigration numbers have changed over time. They calculate percentages and make their own...
Curated OER
Dinosaur Tracks: From Stride To Leg Length To Speed
High schoolers determine the relationship between leg length, stride length, and speed in humans and bipedal dinosaurs. They collect data and graph these human characteristics then use actual data collected from dinosaur track pads and...
Curated OER
Volume and Surface Area: Which Is More?
Learners explore the volume and surface area of three dimensional figures. Through the use of video, students discover three dimensional shapes, their uses in real-life applications, and methods used to calculate their volume and surface...
Curated OER
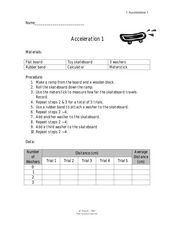
Acceleration 1
In this acceleration worksheet, students use weights to increase the mass affecting the force on moving objects. Students plot a graph of their data and answer 3 questions about how the acceleration of the toy skateboard used in the...
Curated OER
Finding the Area Under A Curve with Random Probability
Students explore the concept of area under a curve. In this area under a curve lesson, students find the area under a curve using the Monte Carlo method using random points and probability. Students calculate the area under the same...
Curated OER
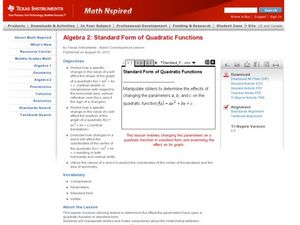
Standard Form of Quadratic Functions
Students factor quadratic equations. In this algebra lesson, students identify the factors and use them to graph the parabola. They find the parameters and vertex of each graph.
Curated OER
Fantasy Basketball
Young scholars play Fantasy Basketball in order to practice locating Internet information and using technology tools to display data; students demonstrate an understanding and use of graphing, probability, and statistics.
Curated OER
Global Warming Statistics
Students research real-time and historic temperature data of U.S. and world locations, and analyze the data using mean, median, and mode averages. They graph the data and draw conclusions by analyzing the data. A spreadsheet is used to...
Curated OER
Determining Mean, Range, Median, Mode, and Probability
Students calculate mean, median, range, mode and probability. Then, working in teams, they use data from their workplace to compute values for these terms. Finally the class explores the term "probability" using a die.
Curated OER
Ready, Set, Go!
Students predict if the height of a ramp affect how far an object travels. They design and conduct an experiment to test their predictions. The results are recorded and a graph is created to show the relationship between ramp height and...
Mathematics TEKS Toolkit
Grade 6: Exploring c/d = pi
Introduce your math class to the perimeter of a circle. Teach them that pi describes the relationship between the circumference and the diameter. As a hands-on investigation, pairs or small groups use string to compare these two values...
Curated OER
Interpreting Data and Building Hypothesis
Students define the term species, and graph species data together with previously collected data at the National Zoo. They interpret graphed data and recognize patterns in the streamside quadrant versus hillside quadrant. Students use...
Other popular searches
- Graphing Calculator and Math
- Algebra Graphing Calculators
- Graphing Calculator Math
- Graphing Calculator Skills
- Graphing Calculator Squares
- Graphing Calculator Lessons
- Graphing Calculator Parabola
- Graphing Calculators Ti 83
- Graphing Calculator Activities
- Graphing Calculator Worksheet
- Ti 84 Graphing Calculator


