Curated OER
Application and Modeling of Standard Deviation
The first activity in this resource has learners computing the mean and standard deviation of two different data sets and drawing conclusions based on their results. The second activity has them using a dice-rolling simulation to...
Curated OER
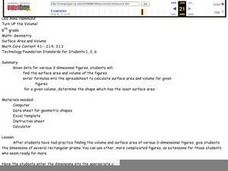
Turn Up the Volume
Measuring volume can be a mystery for 5th graders, but this hands-on activity gives the gift of discovery. The volume of simple rectangular solids and irregular shapes are calculated through various methods including displacing liquid in...
Curated OER
Stick-Slip Movement
Ninth graders operate a model to observe the type of motion that occurs at a fault during an earthquake. They explore the effects of several variables. Students measure movement, calculate averages and plot and graph information.
Curated OER
Count on Me
Fourth graders use inductive reasoning to find algebraic patterns in geometric figures. They use technology (i.e., calculators, computers) and manipulatives to discover number patterns involving geometric concepts. They solve concrete...
Curated OER
Two-Variable Linear Inequalities
Here is an engaging lesson on solving equations with two variables. Have the class rewrite linear equations in the slope intercept form, y=mx + b. They graph the lines using the slope and y-intercepts.
Curated OER
Capture/Recapture
Students use proportions to estimate the size of populations. They describe the data with using a graph or table of the estimate. Students use descriptive statistics to calculate mean, median, and mode. They also compare and contrast an...
Curated OER
Discovering Ohm's Law
Connect math with science! Pupils apply properties of Ohms Law as they solve problems and identify the inverse relationship of a function. They analyze the shape of the graph of an inverse function and use it to make predictions.
Curated OER
Wildlife
The centerpiece of this lesson plan is a predator-prey simulation in which colored paperclips represent different species of animals camouflaged against a colored background. Relevant follow-up questions are provided. The activity is...
Curated OER
The Air Up There
Learners observe the weather over a period of two weeks. They gather local weather data and calculate the mean and average figures from the data. They prepare a graph with their observations.
Curated OER
Penny Pushing
Fifth graders use an Excel spreadsheet to show them how to enter the amount of pennies they bring each week to school for a fundraising project. They count their pennies each Friday and enter the total amount in the correct columns. In...
Curated OER
All About Me: Measuring Height and Weight
Learners take personal fitness inventories. In this personal health lesson, students take measurements of their heights and weights. Learners record the data, calculate their BMI, and then chart their physical activity.
Curated OER
Old Glory
Students utilize mathematical concepts such as: measurement, ratio and proportion and geometric probability to analyze the components of the U.S. Flag. They collect, organize and interpret data by constructing charts, tables and graphs...
Curated OER
See Turtles Nest! See Turtles Hatch!
Students graph data of sea turtles hatching rates from Watamu/Malindi Marine National Park and Reserve in Kenya. In this math lesson, students use real life science data to calculate mean and median values. Students use...
Curated OER
Devising a Measure for Correlation
How well does your class understand the concept of correlation? Use an activity to explore different methods of calculating correlation. Working alone and then in groups, your class will make decisions on what math to apply to the...
Curated OER
Louisville's Best Field Day Park
Students create a survey to hand out to determine the best field day park. Using their local area, they select five parks, if possible, that meet the criteria and calculate the distance and estimated time travel. They use this...
Curated OER
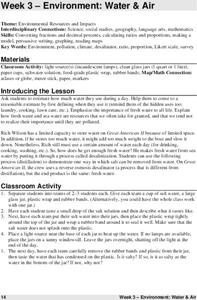
Environment: Water & Air
The introduction to the lesson mentions a sailor's limited capacity to store drinking water on his ship. Pupils then set up an overnight experiment to remove freshwater from salt water by distillation. There is a math and map activity to...
Curated OER
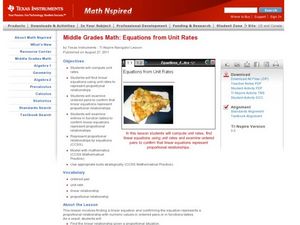
Equations from Unit Rates
Your class can become linear equations masters, as they calculate the rate of change of a function. They observe different types of coordinates as they relate to a graph, then use the Ti-navigator to move the line around and draw...
Curated OER
Pendulums
First-time physicists experiment with pendulums in this physics activity. They vary the weight of the bob, record how long each takes to complete ten period swings, and then calculate the time for one period. They repeat the procedure,...
Curated OER
Reading & Using a Nutrition Label
Students discover the importance of healthy eating. Using food nutrition labels, they read and examine the nutritional value. Students collect the data on a spreadsheet and create a graph. They analyze the media influences on product...
Curated OER
The Outside Dog
Learners observe the book, "The Outside Dog," and predict the events of the story. At the conclusion of the story, students act out various paragraphs from the book and write about specified characters. Additional cross-curriculum...
Curated OER
NUMB3RS Activity: A Matter of Half-Life and Death
Students investigate exponential decay. Students explore the biological half-life of Cesium-137. Students investigate the Goiania Accident of 1987 which is considered one of the worst incidents in the history of the Atomic...
Curated OER
Marvelous Mathematics
Learners make a table on the computer, but create fractions and equivalent fractions through the use of color. They are able to manipulate fractions in order to gain a greater understanding of the meaning of whole number that is broken...
Curated OER
Visual Representation of Reduced Fat
Students demonstrate their understanding of the Five-Number Summary and Box-Plots by analyzing different nutrition labels from regular and reduced fat items using graphing calculators.
Curated OER
Exploding Numbers
Students discuss how numbers increase when exponential growth is occurring. They view a video and compare exponential and linear growth with a graphing calculator.


