Curated OER
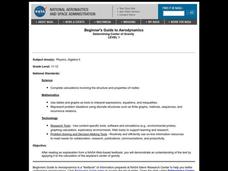
Determining Center of Gravity
Students complete calculations involving the structure and properties of matter. They engage in a variety of problem solving activities to help them determine the center of gravity.
Curated OER
The Price of Relief
Students calculate and graph the costs of essential items needed in Kosovar refugee camps on an individual, family, and camp basis. Additionally, students explore how relief organizations and businesses participate in relief efforts.
Curated OER
Income Levels & Social Class: Is It All About Cash?
Students graph data and interpret that data after reading information about lifestyles and income levels. They calculate percentages, set up spreadsheets and calculate columnar data.
Curated OER
Conic Sections
Students explore the different properties of conics. In this algebra lesson, students calculate the midpoint of a line, the distances between two points as they get ready to find the focus and directrix in eclipse and other conics. They...
Curated OER
Weights of Objects
Students differentiate between the weights of an object on different planets. In this geometry lesson, students investigate different weights and graph their results as it relates to the different planets. They appreciate the design of...
Curated OER
Pumped Up Gas Prices
Students calculate gas prices. In this transportation lesson, students tally the mileage and gas costs of their car for one months. They figure out how much was spent on gas and create a graph showing average gas prices over time.
Curated OER
Inclined Plane and Pulley
Students describe how inclined plane and pulleys make work easier. For this physics lesson, students calculate work done and mechanical advantage of both simple machines. They collect data from the experiment and construct graphs.
Curated OER
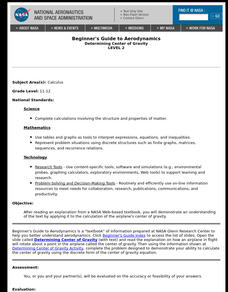
Determining Center of Gravity
Young scholars complete calculus calculations involving the structure and properties of matter and determining the center of gravity.
Curated OER
Epidemic Proportions
Students research epidemics that have devastated world population at various points in history. They share and calculate statistics obtained in their research and develop graphs comparing and contrasting how different epidemics affect...
Curated OER
Percents: (An Application to Real Life Problems)
Seventh graders explore the concept of calculating percents. In this calculating percents lesson, 7th graders simulate ordering food off of a menu. Students work in groups to calculate the bill, tax, and the tip for the...
Curated OER
T-Shirt Lettering
Students determine the cost of a t-shirt using a variety of mathematical operations to solve problems. Then they use a spreadsheet to calculate the cost of lettering a t-shirt and display this information in a graph.
Curated OER
Dinosaur Tracks: From Stride To Leg Length To Speed
High schoolers determine the relationship between leg length, stride length, and speed in humans and bipedal dinosaurs. They collect data and graph these human characteristics then use actual data collected from dinosaur track pads and...
Curated OER
A Geological Puzzle
Students compare and contrast the various types of rocks on each continent. In groups, the calculate the rock ages and types to determine if the continents, in their opinion, were joined at one time. They develop two imaginary...
Curated OER
The Demographics of Immigration: Using United States Census Data
High schoolers work together to analyze United States Census data on immigration. They compare and contrast the data and determine how immigration numbers have changed over time. They calculate percentages and make their own...
Curated OER
Paying for Crime
High schoolers participate in activties examining ratios and proportions. They use graphs to interpret data showing the government's budget for prisons. They present what they have learned to the class.
Curated OER
Michigan Virtual Field Trip
Learners analyze data from a virtual field trip to Michigan. They conduct Internet research on mileage and travel time between cities, calculate and compare fuel costs, and research and calculate lodging, activities, and meal costs.
Curated OER
Music Favorites and Place Value
Fourth graders view CD ads and create a chart about an imaginary CD purchase. In this CD lesson, 4th graders calculate various cost connected with the CD's at the regular price and on sale. Students write a paragraph about the...
Curated OER
Volume and Surface Area: Which Is More?
Learners explore the volume and surface area of three dimensional figures. Through the use of video, students discover three dimensional shapes, their uses in real-life applications, and methods used to calculate their volume and surface...
Curated OER
Deer: Predation or Starvation
In this predation or starvation worksheet, students read about the effects of the wildlife service bringing in predators (wolves) to control a deer population. Students calculate the change in the deer population from 1971 to 1980. They...
Curated OER
Mean, Median, Mode and Range
Fourth graders investigate when to find the mean, median, mode and range. In this statistical concepts lesson, 4th graders collect data, make observations and graph the data. Students verify their work on the computer.
Curated OER
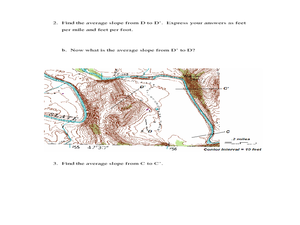
Slope and Topographic Maps
Learners investigate slopes as they study topographic maps. In this algebra lesson, students discuss and apply the concept of slopes to graphing and analyzing data.
Curated OER
Determining Mean, Range, Median, Mode, and Probability
Students calculate mean, median, range, mode and probability. Then, working in teams, they use data from their workplace to compute values for these terms. Finally the class explores the term "probability" using a die.
Curated OER
Changing Twines: Exploring Area and Perimeter
Third graders review formulas for area and perimeter in quadrilaterals. They arrange pre-cut twine on a centimeter graph paper to create non-congruent quadrilaterals. They calculate the perimeter and area of each form.
Curated OER
Interpreting Data and Building Hypothesis
Students define the term species, and graph species data together with previously collected data at the National Zoo. They interpret graphed data and recognize patterns in the streamside quadrant versus hillside quadrant. Students use...


