Curated OER
Surfing the Waves
Students use online resources, including animations,to define the slope of a curve and how to calculate the slope. They solve 8 problems online, using the definition of the derivative of a function at a point to calculate slope of the...
Curated OER
How Much Sugar is in Bubble Gum?
Students conduct an experiment to determine the percentage of sugar in various types of gum. They weigh the gum after chewing it to determine the amount of mass lost from each piece of gum, analyze the data, and create a graph of the...
Curated OER
Curve Ball
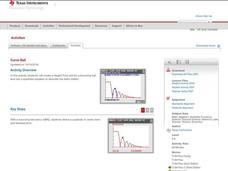
Learners explore the concept of parabolas by collecting quadratic data on a bouncing ball as it is falling using a motion detector. They plot the data and determine the equation of the quadratic in vertex form, then determine the values...
Curated OER
Properties of Parabolas
Learn to identify the properties of parabolas. Students define parabola as the locus of all points equidistant from a fixed point and a fixed line. Also, interpret the equation for a parabola in vertex form and gain a visual...
Curated OER
Finding the Area Under A Curve with Random Probability
Students explore the concept of area under a curve. In this area under a curve lesson, students find the area under a curve using the Monte Carlo method using random points and probability. Students calculate the area under the same...
Curated OER
Carbon Dating
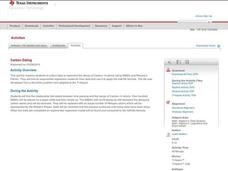
Simulate C-14 decay using M&M and Reese's Pieces candies. In this scatter-plot lesson, high schoolers perform an experiment to simulate the half life of C-14. Information is plotted on a scatter-plot. Students answer four...
Curated OER
Ready, Set, Go!
Students predict if the height of a ramp affect how far an object travels. They design and conduct an experiment to test their predictions. The results are recorded and a graph is created to show the relationship between ramp height and...
Curated OER
Energy Eccentricity
Students assess their own energy use to help develop an awareness of the different types of natural resources affected by consumers. Their calculations show them how much they are personally impacting the Earth. Very meaningful and...
Mathematics TEKS Toolkit
Grade 6: Exploring c/d = pi
Introduce your math class to the perimeter of a circle. Teach them that pi describes the relationship between the circumference and the diameter. As a hands-on investigation, pairs or small groups use string to compare these two values...
Curated OER
Filling Up
In this filling up worksheet, students calculate the E85 per gasoline-gallon equivalent price to the E85 price per gallon to complete a chart of "alternative fuel". They use the data along with the price per gallon of gasoline to plot...
Curated OER
Moooving to Low-fat Milk
Third graders complete two handouts. In this healthy beverages lesson, 3rd graders compare whole, two percent and skim milks. Students use labels to help choose healthy beverages. Students complete an "All About Milk" and "Calculating...
Curated OER
Let's Keep Track of Grades
Students participate in a technology project. This lesson is a hands-on spreadsheet project where students are responsible for keeping track of their grades for class. The students learn to enter data into a spreadsheet, create...
Curated OER
Wildlife Management
Students examine the effects of various management strategies on the size of wildlife populations. Each student simulates the management of an animal population in a card game, graphs the results of the wildlife game, and participate in...
Curated OER
Properties of Parabolas
Have your learners investigate parabolas. For this Algebra II lesson, high schoolers explore the basic definition of a parabola by using Cabri Jr. to create a parabola given the focus and directrix. Students interpret the equation...
Curated OER
Slopes and Linear Equations
Students find the slopes of linear functions. In this graphing lesson, students analyze linear equations and calculate the slope of the line. They graph a line given the slope and y-intercept.
Curated OER
Collect Data Using a Transect Line
Students learn about transect lines through a study of marine debris. In this marine debris activity, students calculate the items on a transect line and graph them. Students complete a category worksheet.
Curated OER
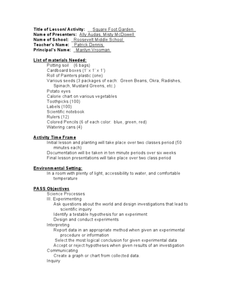
Square Foot Garden
Students plant a garden and keep track of it. In this geometrical garden instructional activity, students collect data from their garden twice a week. They graph their finding and figure out how many square feet of growing space...
Curated OER
At the Edge of the Continent
Learners study how to interpret a bathymetric map. They study the main features of the continental margin. They plot and graph bathymetric data. They think about and discuss the bathymetry of the edge of the cont
Curated OER
Talking Trash - Marine Debris
Students bring in different trash items and define "marine debris" through a discussion about these items. They categorize debris and use statistics and graphing to better explain the types and amounts of marine debris found each yea
Curated OER
Math: Currency Exchange Rates
Sixth graders apply the division and multiplication of decimals to convert dollars to various international currencies. In a travel simulation activity, they convert money, distance, and temperatures. During their "trip," students...
Curated OER
Farming: It's a Fact!
Students use worksheets, food items, and computer programs to learn about the path of food from the farm to their meals. In this agriculture lesson plan, students use a provided worksheet to learn facts about farming. They use a bag of...
Curated OER
How Trees Contribute to the Water Cycle
In this water cycle instructional activity, 3rd graders conduct an experiment where they observe and calculate how water transpires in different types of trees. Students engage in a class discussion and use Venn Diagrams to compare...
Curated OER
TE Lesson: Factors Affecting Friction
Students investigate the effect of weight on normal friction or the friction due to surface roughness. They tell about the effects of contact area that occurs as a result of molecular attraction by looking at data on line graphs.
Curated OER
Data Analysis and Measurement: Ahead, Above the Clouds
Students explore and discuss hurricanes, and examine how meteorologists, weather officers, and NASA researchers use measurement and data analysis to predict severe weather. They plot points on coordinate map, classify hurricanes...


