Curated OER
On the Road Again
Students work with patterns to develop formulas that will help them determine total cost. In this patterning lesson, students watch a video about an NBA trainer. (not included) They work in groups to access the assigned Internet websites...
Curated OER
Mean Median and Mode
Young scholars collect data, graph it and analyze it. In this statistics lesson plan, students plot their data and calculate the mean, median and mode explaining how it relates to the data. They define the ways to find the mean, median...
Curated OER
Jelly Bean Math
Students estimate, measure, compute, and create patterns using jelly beans. In small groups, they solve various calculations, place jelly beans into groups, invent a new flavor, create a pattern, and complete a worksheet.
Curated OER
Using Color as Defense
Learners explore mimicry and crypsis, participate in hands-on predator-prey activity, and practice calculating averages and graph results in histogram.
Curated OER
Infusing Equity in the Classroom by Gender
Students investigate the idea of gender descrimination in the classroom. In this algebra lesson, students collect data in stereotyping, and gender bias in the classroom, school materials and activities. They graph and analyze their...
Curated OER
Investing Money
Sixth graders participate in an simulated investment activity. They examine the purpose of different types of investments before they predict which will be the most successful. Finally, they simulate investing $1,000 in stocks, $1,000 in...
Curated OER
Illuminating Climate Change: Connecting Lighting and Global Warming
Students analyze energy usage and connect energy usage to fossil fuel consumption. In this global warming and pollution lesson, students what fuels are used to generate electricity and how much CO2 each fuel produces, then graph the...
Curated OER
Simple Machines: The Wede & Lever
Students describe how wedge and lever makes work easier. In this physics lesson plan, students analyze experimental data by creating a graph to see the trends. They calculate the work done and mechanical advantage of these simple machines.
Curated OER
Surface Friction and Wear Characteristics of Common Materials
Students identify the factors affecting friction. In this physics lesson, students construct their own rocket car and race them. They graph the average speeds and discuss how lubricants affect friction between rubbing surfaces.
Curated OER
Physics and Me
Sixth graders compare and contrast mass and weight. In this physics lesson, 6th graders calculate speed given distance and time information. They construct a rocket and relate this to Newton's 3rd Law of motion.
Curated OER
Linear Programming and the Inequalz App
Learners graph system of linear inequalities in this lesson. Your class will use the Inequality Graphing App to enter linear programming functions into the calculator that can be stored for later use. They then determine the maximum for...
Curated OER
Precalculus: Function Models for Real-Life Situations
Young scholars use calculators and "by hand" techniques to compare models of real-life data situations, determine the best model for a situation, and use their models to make predictions.
Curated OER
From Playing with Electronics to Data Analysis
Students collect and Analyze data. For this statistics lesson, students identify the line of best fit of the graph. They classify lines as having positive, negative and no correlation.
Curated OER
Model Data with Quadratic Functions
Students model data using quadratic equations. In this algebra lesson plan, students simplify and factor quadratic equations. They graph the function using collected data and analyze the parabola.
Curated OER
The Factor Connection
Pupils investigate the connection between factors, zeros, and graphs of quadratic functions. The lesson requires the TI-nspire handheld.
Curated OER
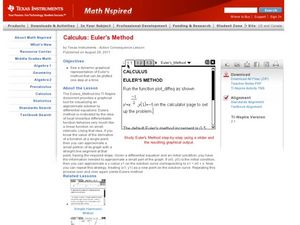
Euler's Method
Learners identify Euler's method of graphing in this calculus lesson. They approximate values of a function and check their work using EM. They also differentiate equations at an exact point.
Curated OER
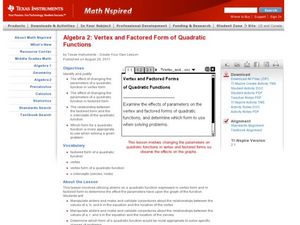
Vertex and Factored Form of Quadratic Functions
Students graph quadratic equations. In this algebra instructional activity, students solve quadratic equations by factoring. They identify the end behavior of the graph.
Curated OER
Match Me Plus
Have your class investigate Piecewise functions by matching a position versus time graph to the function that describe the walk.
Curated OER
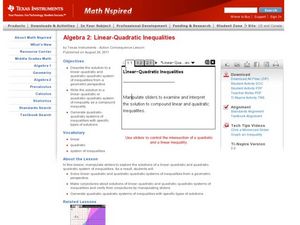
Linear-Quadratic Inequalities
Pupils graph linear and quadratic functions. In this algebra lesson, students create graph with specific coordinate points. They use the Ti to visualise and differentiate between the two functions.
Curated OER
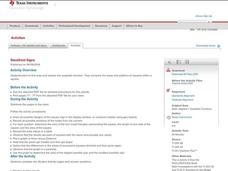
Storefront Signs
Learners practice finding the areas and patterns within a square and explore the concept of quadratic functions. They observe and record the area values in a table, plot a graph of Area versus Distance and complete a variety of student...
Curated OER
Exploring Infinite Series
Learners analyze geometric series in detail. They determine convergence and sum of geometric series, identify a series that satisfies the alternating series test and utilize a graphing handheld to approximate the sum of a series.
Curated OER
Solving Systems by the Elimination Method
Pupils solve equations by elimination and use the TI to graph the lines and find the point of intersection.
Curated OER
Factoring Trinomials
Learners factor trinomials using patterns and their TI to graph their results and make predictions through this lesson. This is accomplished by solving quadratic equations through FOIL and algebra tiles.
Curated OER
It's About Time
Students investigate how Global Positioning Systems work and how and why GPS receivers make errors. They graph data points and apply estimation and prediction to real-life GPS situations, discuss time delay, and complete a worksheet.


