Curated OER
Aging & Body Changes
Learners complete several activities that have to do with aging. In this body changes lesson students take group averages, measure flexibility and see their changes over time.
Curated OER
Design of Airfoil for Given Lift
Students use FoilSim to design an airplane wing that generates a given lift. As they change parameters such as airspeed, altitude, angle of attack, thickness and curvature of the airfoil, and size of the wing area, the software...
Curated OER
The Lift Equation
Students use the FoilSim educational software program to complete an activity regarding lift. They solve a multivariable equation for each of the variables and apply the results to various problems in different situations.
Curated OER
Exponential and Exponents Functions
Students solve problems using exponential properties. In this algebra instructional activity, students differentiate between exponents, exponential and log functions. They graph their functions using table and exponents.
Curated OER
Modeling Population Growth
Students collect data on population growth. In this statistics lesson, students graph their data and make predictions. They find the linear regression and the best fit line.
Curated OER
How are Trig Ratios Used to Measure Triangle Sides
Students identify the ratios of trig identities. In this geometry lesson, students solve the missing sides and angles of triangles using trig ratios. They relate the graphs and waves to real life scenarios.
Curated OER
Air Temperature and Kinetic Energy
Students use a NASA website do activities which help them better explain how air temperature and kinetic energy are related to aircraft propulsion.
Curated OER
Record 'The' Results
Third graders predict how many times they'll see the word "the" in a newspaper page and highlight all the "the"s they find. After reviewing definitions of range, median, mode, mean they create a Stem and Leaf Plot and a Back-to-Back Stem...
Curated OER
Area & Perimeter
Students define area and perimeter. They demonstrate understanding of the concepts concretely, with manipulatives, and describe with words, their strategies and thought processes.
Curated OER
The World is a Village
Students observe Americans through the eyes of the world. In this human population lesson, students utilize the Internet to view the World Pop Clock and follow the world's population by the minute. Students predict what the...
Curated OER
What's the Best Deal?
Young scholars explore number sense by solving consumer math problems. In this pattern identification lesson, students analyze a list of numerical and geometric patterns while predicting the future outcome. Young scholars utilize...
Curated OER
Jelly Bean Egg Challenge
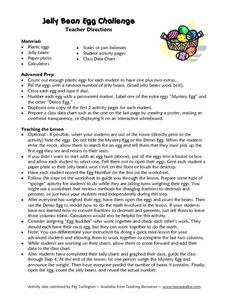
Students each receive a plastic egg filled with jelly beans. In this Jelly Bean Egg Challenge, students estimate and weight their eggs, they count the number of jelly beans inside their egg, they chart their data and compare their data...
Curated OER
How Can Entrepreneurs Control Costs?
Students calculate fixed and variable costs. For this costs lesson, students read a case study about an entrepreneur and her business costs. Individuals complete the provided worksheets to find costs and make related business decisions....
Curated OER
Proof of the Pythagorean Theorem Using Transformations
Middle and high schoolers construct a triangle using Cabri Jr. They construct squares on each of the legs and hypotenuse of the triangle. Pupils show that the area of the squares on the leg equal the area of the square on the hypotenuse.
Curated OER
Dilations in the Plane
Tenth graders investigate dilations and explore the dilation transformation before investigating the properties of a dilation using Cabri Jr. High schoolers extend the concept of dilatation to the coordinate plane.
Curated OER
Determining the Relationship Between pH and Hydrogen Ions with Microcomputer Based Lab (MBL) and/or Calculator Based Lab (CBL) Equipment
Young scholars find the relationship between the variables based on experimental data. They determine mathematical relationship between pH and the amount of hydrogen Ions in solution.
Curated OER
Collecting, organizing and comparing data for cellular telephone buying and calculating average, and median price and best deal per cost.
Students research data and develop statistical methods such as mean and median price and make convincing arguments as powerful ways for decision making.
Curated OER
Sorting Pennies, A Wagering Activity for Algebra I
Students solve weight equations. In this equations lesson, groups of students weigh and separate pennies to find information necessary to solve simultaneous equations. The teacher provides equations based on the weight of pennies before...
Curated OER
Reservoir Activity
Students research the economic importance of the major reservoirs in Illinois. In groups, they manage a budget for one of the lakes to promote tourism in the area. They also work together to create advertisements.
Curated OER
Introducing Linear Terminology
Ninth graders graph linear equations and inequalities in two variables and then, they write equations of lines and find and use the slope and y-intercept
of lines. They use linear equations to model real data and define to define the...
Curated OER
Candy Colors: Figuring the Mean, Median, and Mode
Students count candy by color and then calculate mean, median, and mode. They count candy and use the data to calculate mean, median, and mode (by color) and apply their learning to another collection of data.
Curated OER
Velocity vs. Time
Twelfth graders read and interpret v-t graphs. After studying velocity and time, 12th graders read graphs to calculate the acceleration of a moving body and determine the distance and displacement of a body. Students explore the...
Curated OER
That's a Fine Line You're Walking!
Students experiment with Hiker program to practice real world applications of linear functions and develop their understanding of expressions, relationships, and manipulations involved in writing and graphing linear equations in...
Curated OER
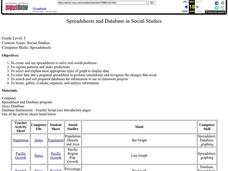
Spreadsheets and Database in Social Studies
Fifth graders create/use spreadsheets to solve real-world problems, explore patterns and make predictions, select/explain most appropriate types of graph to display data, and enter data into a prepared spreadsheet to perform calculations.


