Curated OER
6-8 Baseball Fun: Percentages, Decimals, and Fractions
Students practice the concepts behind fractions, decimals, and percents by using sports statistics on baseball cards. In this baseball math lesson, students use fractions and estimation to calculate statistics. Students calculate batting...
Curated OER
A Relatively Far Out Idea: Estimating
Pupils investigate methods of estimating through cooperative group activities, hands-on activities, the use of tables and graphs and an interactive video.
Curated OER
Discovering Density
Students explore the physical properties of density. In this hands-on lesson, students calculate density and distinguish between intensive and extensive properties.
Curated OER
In the Right Mode
Sixth graders practice determining mean, median, mode, and range using individual mileage logs. They convert miles to kilometers and graph their results.
Curated OER
Skittles Lab
Pupils use Skittles as manipulatives to practice computing decimals from fractions, computing decimals into percentages, and creating bar graphs from gathered data.
Curated OER
Points of Intersection
Students solve systems of equations. In this solving systems of equations lesson, students look for the intersection of the two lines in the system. Students solve systems that have one solution, no solution, and infinite...
Curated OER
Find That Bargain!
Students explore the methods of calculating percentages, reading and the construction of graphs, and an awareness of consumer concerns in this lesson. The movement of the decimal point often results in uncertainty and confusion. This...
Curated OER
Earthquakes
Eighth graders demonstrate the mathematical components of a scientific problem as well as illustrate how real world problems can be solved using math. They demonstrate math skills such as rate calculation, graphing, and linear equations.
Curated OER
Consistent Circles
Students create a design of a circle. In this geometry lesson, students identify the measure of the diameter and radius of a circle. They graph and analyze their collected data and write equations based on direct variation.
Curated OER
Quadratics: Polynomial Form
Learners determine how changes in the coefficients in a quadratic function affect its graph. They determine how to use the equation to determine the intercepts of a quadratic function. Students identify the location of the intercepts...
Curated OER
Particle Motion 2
Students analyze the motion of a particle along a straight line. In this precalculus lesson, students use the TI to analyze the position of a function as they graph and visualise the function. They calculate the distance and...
Curated OER
Earth Science: In Depth Look at Earthquakes
Young scholars engage in an interactive Internet lesson covering the reasons and results of earthquakes. After reading eyewitness accounts and viewing animations, they use seismograms to measure and locate the epicenters. In an ongoing...
Curated OER
Forces and Motion-The Downhill Racer
Students calculate a toy car's velocity and acceleration. In this force and motion lesson, students build ramps and attach a dropper to a toy car, which is released down the ramp. Students calculate and graph velocity and acceleration...
Curated OER
Box Plots
Students review the concept of median, explore how to calculate quartiles for any size data set and experience how to build a box plot.
Curated OER
M&M Caper
Pupils participate in a game with M&M's to be introduced to percents and ratios. Individually, they estimate and record the number of candies they believe the bag holds and the amount of each colored candy. They open the bag and...
Curated OER
Pumpkin Properties are a Smash!
Students receive a miniature pumpkin and proceed through several stations to measure a variety of physical properties. The data is entered into a data sheet and the mass and volume measurements are used to calculate density. They also...
Curated OER
He Came Out Of Nowhere!
Students calculate the traveled speed and distance of a robot. In this geometry lesson, students use the distance formula to manipulate and use to solve for the required variable. They calculate answers where two variables are...
Curated OER
It's a Drag!
Pupils create number lines using decimals and whole numbers. In this algebra lesson, students graph and solve linear equations. They plot ordered pairs on a coordinate plane correctly.
Curated OER
Box and Whisker Plots
Seventh graders explore the concept of box and whisker plots. In this box and whisker plots instructional activity, 7th graders plot data on a box and whisker plot. Students discuss the mean, median, and mode of the data. Students...
Curated OER
World Population Study
Students explore an exponential relationship and how it relates to human population growth and the current global population crisis. They graph both exponential and linear information.
Curated OER
Monitoring Oxygen Level
Students measure oxygen percentages in room air and air exhaled after they perform various activities. They explore various websites, and record and analyze the data from the experiments.
Curated OER
Vertical and Horizontal Translations
Students analyze function graphs. In this Algebra II/Pre-calculus instructional activity, students investigate the graph of a function as they determine to which family of functions it belongs, determine the parent function and...
Curated OER
Propellers, Forces and Energy
Students construct a model airplane, measure distance, and calculate velocity. In this creative lesson students work in groups to build a model and use it to calculate distances and velocity.
Curated OER
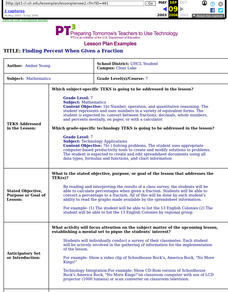
Finding Percent When Given A Fraction
Seventh graders calculate percentages when given a fraction. They convert a percentage to a fraction. All of this be done by each student's ability to read the graphs made available by the spreadsheet information.


