Curated OER
Lyrics Statistics
Students describe, analyze and generalize relationships, patterns, functions using words. symbols, variables, tables and graphs.
Curated OER
Connecting Measurement
Pupils participate in activities the connect measurement to geometry, statistics, estimation, and the real world. They collect measurements from their elbow to the tip of their middle finger and make a box plot of the data as well as...
Curated OER
Who is Being Left Behind?
Students investigate scores as they relate to race. For this algebra lesson, students analyze standardized scores and how race can affect these scores. They plot their findings on a graph and draw conclusions.
Curated OER
Eratosthenes And Radius of the Earth
Students calculate the radius of the earth. They use the method and data suggested by Eratosthenes. They investigate the interrelationships among mass, distance, force, and time through experimental processes.
Curated OER
Price of Apples- Linear Data
Students collect data and create a graph. In this algebra lesson, students describe functions graphically, algebraically and verbally. They identify functions as being independent and dependent using variables.
Curated OER
A Study of a Quadratic Function
Students factor and solve quadratic equations. In this algebra lesson, students play a game as the collect and graph data. they identify properties of their parabola and make predictions.
Curated OER
Burning Snacks in Chem Lab
Pupils determine the energy content of various snack foods. They measure the temperature changes in various snack foods as the foods are burned in order to determine the foods' energy content. Students create graphs and data tables of...
Curated OER
Guess the Age
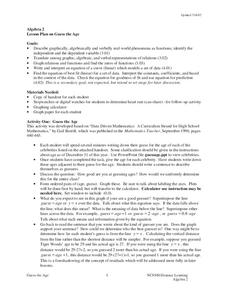
Students describe graphically, algebraically and verbally real-world phenomena as functions; identify the independent and the dependent variable. They translate among graphic, algebraic, and verbal representations of relations and graph...
Curated OER
Investigating Functions
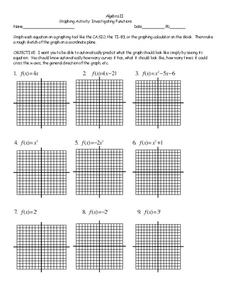
In this investigating functions learning exercise, 11th graders solve and complete 18 different problems. First, they graph each equation on the graphs shown. Then, students make a rough sketch of graph on a coordinate plane. They also...
Curated OER
Guess the Age
Learners explore functions using real world application. In this algebra lesson, students play a game as they apply concepts of function. They graph their findings and discuss it with the class.
Curated OER
Rational Functions
For this Algebra II/Pre-calculus worksheet, students solve and graph rational equations, identifying the intercepts and asymptotes. The six page worksheet contains nine problems. Answers are not provided.
Curated OER
Motion of a Bouncing Ball
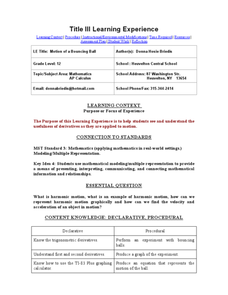
Twelfth graders complete a unit of lessons on derivatives as they are applied to motion. They observe and discuss demonstrations, conduct an experiment involving a motion sensor, graph and analyze the results, and summarize their findings.
Curated OER
Probability
Students investigate probability. In this fourth through sixth grade mathematics activity, students collect, organize and display data in an appropriate chart or graph as they calculate and apply basic probability.
Curated OER
Slopey Math
Students identify the slope of a line and use it to solve real life problems. In this algebra activity, students write linear equations in slope intercept form and make a correlation to its relation to the real world. They use the slope...
Curated OER
Don’t Sit Under the Apple Tree…You Might Become Famous
Students explore Newton's laws using CEENBoTs. In this physics instructional activity, students collect data and create tables and graphs. They calculate speed, acceleration and forces using mathematical formulas.
Curated OER
The Swinging Pendulum
Students observe a pendulum and graph their observation. In this algebra lesson, students use the TI calcualtor to graph the motion the pendulum makes. They analyze the graph and make predictions.


