Radford University
How High Can You Throw?
Find heights by measuring time. Teams collect data to determine the height that a tennis ball is thrown. Classmates measure the height of the initial release of the ball and how long it stays aloft. Using a projectile motion equation,...
Illustrative Mathematics
Electoral College
A cross-curricular resource that takes the electoral votes and allows your learners to organize and analyze the data. Young voters can determine which states are more influential and interpret the dotplot provided for more data....
CK-12 Foundation
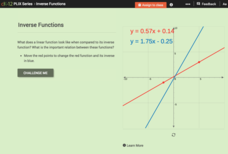
Inverse Functions
Provide a graphical view of inverses. Pupils manipulate points on a line and see the relationship of the graph with the graph of its inverse. Using the relationship between the graphs, scholars respond to questions concerning inverses...
Shodor Education Foundation
InteGreat
Hands-on investigation of Riemann sums becomes possible without intensive arithmetic gymnastics with this interactive lesson plan. Learners manipulate online graphing tools to develop and test theories about right, left, and...
EngageNY
Obstacles Resolved—A Surprising Result
The greater the degree, the more solutions to find! Individuals find the real solutions from a graph and use the Fundamental Theorem of Algebra to find the remaining factors.
K20 LEARN
Driving Rationally: Introduction To Rational Functions And Asymptotes
Calculating average speeds is not as simple as finding an average. The lesson introduces class members to rational functions by presenting a problem about finding an average speed for the rest of a trip. Pupils develop an equation to...
College Board
So Much Data, So Little Time
Organizing data in a statistics class is often a challenge. A veteran statistics teacher shares data organization tips in a lesson resource. The instructor shows how to group data to link to individual calculators in a more efficient...
EngageNY
Finding One Hundred Percent Given Another Percent
Class members solve problems to find the whole when given a percent. They use double line numbers and factors of hundred to help break the 100 percent into equal segments.
101 Questions
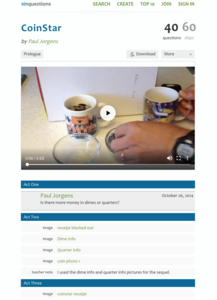
CoinStar
Would you rather have a bowl of dimes or a bowl of quarters? A video introduces the problem by presenting two bowls, one full of quarters and another full of dimes. Learners use information from a CoinStar receipt to calculate the number...
Illustrative Mathematics
Springboard Dive
Quadratics and height application problems go hand in hand like teenagers and sleeping in. High schoolers must look at the equation of a diver's height and calculate such features as the height of dive board, time entering the water, and...
CK-12 Foundation
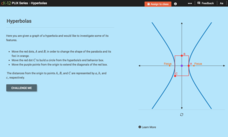
Hyperbolas
Hyperbolas—practice thinking outside of the box. Pupils alter the end behavior box to create various graphs of hyperbolas. They determine formulas to find the distance from the origin to the foci. Using that information, scholars...
Curated OER
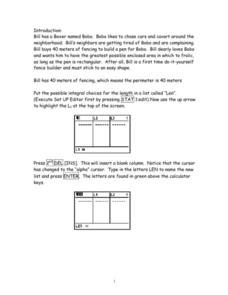
A Boxer named Bobo
Bobo the Boxer needs a pen and algebra learners need to find the maximum area that can be created from a fixed amount of fence. A graphing calculator is used to assist in their exploration.
Mathematics Assessment Project
Funsize Cans
Designing fun-size cans ... what fun! Class members use the provided questions to determine the dimensions of a can with a minimum surface area for a given volume. The task allows learners to use graphs or algebraic manipulation to...
Curated OER
Energy Audit
Students collect data about energy usage and use mathematical calculations to analyze their data. In this energy conservation and statistics math lesson, students survey their homes to complete an energy usage worksheet. Students...
Curated OER
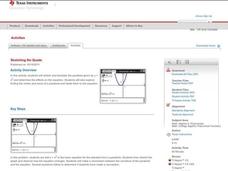
Stretching the Quads
Scholars investigate transforming parabolas. In this transforming parabolas lesson, they take the parent graph y=x^2 and transform it by shifting left, right, up, and down and shrinking and stretching. The class finds maximums,...
Curated OER
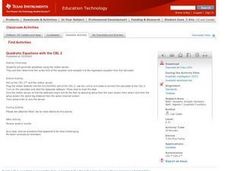
Quadratic Equations with the CBL 2
Learners practice generating parabolas with a motion sensor while determining the vertex form of the equation. They compare it to the regression equation from the calculator onto a data mate software. Each student completes several...
Curated OER
Murder in the First Degree - The Death of Mr. Spud
Secondary learners investigate exponential functions in a real-world scenario. They collect data on the temperature of a cooling baked potato, enter the data into lists, and graph the data using a scatter plot before finding an...
University of North Texas
Math Exam 1 Review
Perfect as a review guide, this worksheet provides a range of questions focusing on functions. Topics include composing functions, transformations, domains, and polynomials. Also included are corresponding worksheets focusing on other...
Curated OER
Math: Will The Airplane Get Off the Ground?
Students use data from real-life models to calculate and compare the force required for an airplane of a given weight to become airborne. They use a graphing calculator to evaluate data and use the World Wide Web to access data.
Curated OER
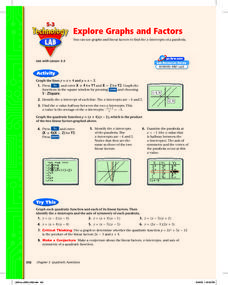
Explore Graphs and Factors
Pupils graph the factors of a quadratic as linear equations and graph the parabolic equation in factored form. Also, they investigate the relationship between the x-intercepts of the lines and the zeros of the parabola.
Curated OER
Wacky Water World: Student Worksheet
In this math worksheet, students will work alone or in pairs to determine which theme park ticket package is a better deal. Students will use data provided in the worksheet and a graphing calculator to make the decision.
Curated OER
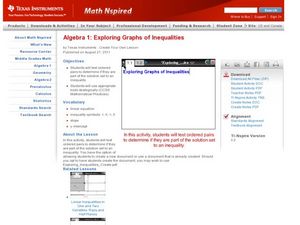
Exploring Graphs of Inequalities
Learn how to solve inequalities and graph their answers. Students use addition, subtraction, multiplication and division to solve problems. They analyze their graph using the TI calculator.
Curated OER
Application of Graph Theory
Students investigate different online tutorials as they study graphing. In this graphing instructional activity, students apply the concept of graphs cross curricular and use it to make predictions. They define the purpose and theories...
Curated OER
Graphing Using Excel
Fifth graders complete a series of graphs by gathering information and using Excel to graph the information. In this graphing lesson, 5th graders graph favorite desserts of the class. Student put their results into the...


