CK-12 Foundation
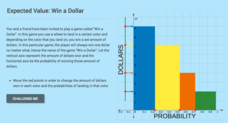
Expected Value: Win a Dollar
Spin a wheel, land on a color ... and win. Learners create a graph to display the probabilities of the amount of money they can win by spinning a colored wheel. The pupils use the dollar amounts and their probabilities to calculate the...
EngageNY
The Binomial Theorem
Sometimes, there is a better way. Scholars develop Pascal's triangle as a method to arrive at the coefficients of binomial expansions as an easier method to expand binomials. The learners connect the formula for binomial coefficients to...
CK-12 Foundation
Linear Inequalities in Two Variables
Take the tediousness out of finding solutions of inequalities by graphing. Individuals use an interactive that allows them to adjust a system of inequalities on a coordinate plane. Using the interactive helps find solutions to systems of...
Mathematics Vision Project
Module 6: Modeling Periodic Behavior
Around and around we go ... again, and again, and again, and again! That's the nature of a periodic function. Young scholars learn how to model a periodic pattern with trigonometric functions. The nine-lesson unit explores the connection...
Curated OER
Graphing Quadratic Functions
Pupils explore quadratic functions in this algebra lesson. They investigate transformation of quadratic functions using the TI calculator. They use the vertex form for this lesson.
Curated OER
Exploring Linear Equations And Scatter Plots - Chapter 5 Review
Students complete rolling stocks experiment, and collect and enter data on the computer. They enter data on graphing calculators, complete scatter plot by hand with line of best fit, and discuss different graphing methods.
Curated OER
Parabolas
Students investigate parabolas and their equations. In this parabolas and their equations lesson, students graph quadratic equations on their graphing calculator. Students find the axis of symmetry of a parabola. ...
Curated OER
Cost Calculations Lesson Plan
Students analyze data using graphs and equations. In this algebra activity, students calculate the cost of lumber, convert price per foot to price per piece, solve equations using addition and subtraction and give exact answer when...
Curated OER
TI Math, Games
Students solve problems using technology. In this algebra lesson, students apply flow diagrams and computer codes to solve problems. They use the TI to view the graphs.
Curated OER
Graphs
In this graphing worksheet, 9th graders read one page of graphing examples and complete 8 exercise problems. Each problem involves graphing and coordinates.
Curated OER
Straight Line Graphs
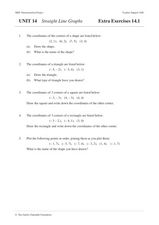
In this algebra worksheet, students graph coordinate pairs on a coordinate plane. They match points with letters and graph a line through all the plotting to create a straight line. There are 25 questions with an answer key.
Curated OER
Watermelon Graphing
Students discover bar graphs. In this primary math lesson plan, students identify the parts of watermelon seeds and other seeds. Students learn the proper names and common names which refer to the parts of the seeds as they create a bar...
Curated OER
Making a Circle Graph of a Sample Budget
Students examine a sample budget and categorize the entries as a group. Then in small groups they convert budget category totals to percents and degrees to make a circle graph related to a sample budget.
Curated OER
Build A Skittles Graph
Students explore graphing. In this graphing lesson, students sort Skittles candies and use the color groups to create a bar graph. Rubrics and extension activities are provided.
Curated OER
Circle Graphs and Percents
For this circle graph and percentages worksheet, learners fill in a chart, write percentages, calculate discounts, and more. Students complete 4 sets of problems.
Curated OER
Circle Graphs
Fifth graders explore to find the central angle and percent. In this circle graph lesson, 5th graders use formulas to calculate the central angle and a protractor to create their graph. Students complete a graphing sheet for homework.
Curated OER
Graphing Data
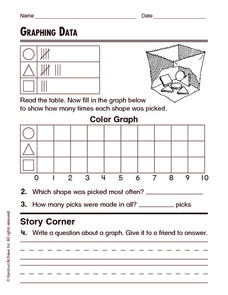
In this graphing data worksheet, students solve and complete 8 different word problems related to graphing data given. First, they determine the percent of people who do not believe in any of the phenomena described and explain. Then,...
Curated OER
Math Who Am I?
In this math vocabulary activity, students read each description of a math term and write the word on the blank line. They circle every third letter in each letter box next to the clue to check their answer. They complete 8 definitions.
Curated OER
Introduction to Representing and Analyzing Data
Represent data graphically. Allow your class to explore different methods of representing data. They create foldables, sing songs, and play a dice game to reinforce the measures of central tendency.
National Security Agency
It's Probably Probable
Learners make predictions and draw conclusions from given information as they learn the meaning of probability in this vocabulary-rich, integrated activity that presents a variety of teaching strategies to motivate and reach...
Curated OER
Agriculture and the Government
Students study the government's involvement in the U.S. A's food production and make connections relating to farm programs. In this historical agriculture lesson, students read content and research significant information....
Curated OER
The Shortest Line Mystery
Students calculate the shortest distance of various scenarios. In this algebra lesson, students interpret graphs of optimization problems. They use a graphing calculator to assist them in graphing and making predictions.
Curated OER
Graphing Linear Equations with Calculator
Students graph lines using the calculator. In this algebra lesson, students graph lines of equations in the form y=mx+b. They input equations into the TI Calculator and graph using the slope and intercept. They analyze the graph for...
Curated OER
Statistical Analysis For Graphing Calculators
Students analyze date from the Chesapeake Bay. Using a graphing calculator, they enter the data, plot three temperatures, and create a Box and Whisker plot.


