Curated OER
Using the Ti-83 Graphing Calculator
In this graphing calculator worksheet, students complete 11 operations on the calculator. Students enter absolute value, exponents, radicals, fractions, mixed numbers, etc.
Curated OER
Introduction to Limits
High schoolers practice using graphing calculators and spreadsheets as they explore numeric limits using sequences and functions. They complete a sequencing worksheet, and determine which sequence corresponds to story a story called...
Virginia Department of Education
Solving Linear Equations
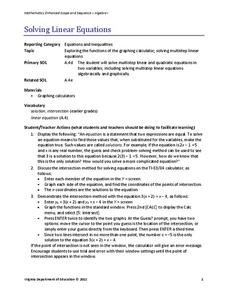
Practice solving linear equations by graphing. Scholars learn to solve multi-step linear equations in one variable by graphing both sides of the equation separately. They use graphing calculators to find the intersection of the graphs.
Curated OER
Fun with Math using Magnetic Force
Sixth graders explore and discuss the effectiveness of magnets in different situations. For this math lesson, 6th graders discuss rate and graphs after exploring with magnets using different restrictions on the magnets. They analyze...
Curated OER
Graphing Our Snacks
Students gather information from Nutrition Facts labels on their favorite snack foods. They graph the fat content of the foods and reflect on what they see.
Curated OER
Graphing Inequalities in Equations
Can a person solve and graph inequalities in one variable? Sounds impossible but it's not! Young mathematicians solve and graph inequalities in algebraic equations. They find a range of possible values for a variable as they solve...
Curated OER
Graph of a Function
In this graph of a function worksheet, learners graph a function and find the value at a given point. They determine the absolute minimum and maximum of an interval. This two-page worksheet contains three problems.
02 x 02 Worksheets
Inverse Variation
Discover an inverse variation pattern. A simple lesson plan design allows learners to explore a nonlinear pattern. Scholars analyze a distance, speed, and time relationship through tables and graphs. Eventually, they write an equation to...
EngageNY
Awkward! Who Chose the Number 360, Anyway?
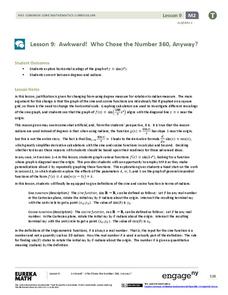
Don't give your classes the third degree. Use radians instead! While working with degrees, learners find that they are not efficient and explore radians as an alternative. They convert between the two measures and use radians with the...
Texas Instruments
Math TODAY for TI-Navigator System - Is Leisure Time Really Shrinking?
High schoolers organize data from the USA TODAY Snapshot, "Is leisure time really shrinking?" into two scatter plots and determine the quadratic model for each scatter plot. They determine if these graphs intersect and learn the concept...
Curated OER
The Barbie Bungee Drop
What do math, bungee jumping, and Barbie® have in common? Young adventure seekers use rubber bands as bungee cords to predict a thrilling, but safe, jump for their doll. First, test jumps are conducted with a few rubber bands. Then more...
EngageNY
Modeling with Quadratic Functions (part 1)
Relevance is key! The resource applies quadratic modeling by incorporating application of physics and business. Pupils work through scenarios of projectile motion and revenue/profit relationships. By using the key features of the graph,...
Virginia Department of Education
Analyzing and Interpreting Statistics
Use measures of variance to compare and analyze data sets. Pupils match histograms of data sets to their respective statistical measures. They then use calculated statistics to further analyze groups of data and use the results to make...
Cornell University
Math Is Malleable?
Learn about polymers while playing with shrinky dinks. Young scholars create a shrinky dink design, bake it, and then record the area, volume, and thickness over time. They model the data using a graph and highlight the key features of...
Texas Instruments
Drawing a Line Tangent to a Circle
Explore lines tangent to a circle. In this math lesson, students manipulate circles and lines on a TI calculator. They draw a circle and analyze perpendicular lines intersecting the circle in only one place. This activity works...
EngageNY
Modeling with Quadratic Functions (part 2)
How many points are needed to define a unique parabola? Individuals work with data to answer this question. Ultimately, they determine the quadratic model when given three points. The concept is applied to data from a dropped...
EngageNY
Multi-Step Problems in the Real World
Connect graphs, equations, and tables for real-world problems. Young mathematicians analyze relationships to identify independent and dependent variables. These identifications help create tables and graphs for each situation.
Curated OER
Explorations 5: Introduction to Limits
In this limit worksheet, students find the interval values of given functions. They identify constants, and plot graphs. This three-page worksheet contains approximately 20 problems.
Alabama Learning Exchange
Building Functions: Reverse to Inverse
Reverse the wrapping to get to the gift. Using the idea of unwrapping a gift, the lesson introduces the concept of inverses. Pupils first determine the order needed to evaluate a function at a point, then use the reverse to find the...
Texas Instruments
Function Notation - Texas Instruments
Using a TI-Nspire calculator, learners will work to better understand function notation and input/output functions. They write equations with a function symbols, identify what makes an equation a function, and graph lines in order to...
California Education Partners
Colorful Data
Scale up your lessons with a performance task. Young data analysts work through an assessment task on scaled bar graphs. They answer questions about a given scaled bar graph on favorite colors, analyze a bar graph to see if it matches...
Mt. San Antonio Collage
Quiz 1: Functions, Domain and Range
Take the work out of worksheets and use these problems and worked-out answer key as a resource. The problems reinforce skills in domain and range, identifying graphs, and even and odd functions.
Concord Consortium
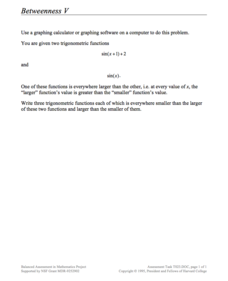
Betweenness V
Take a unique approach to study the graphing of trigonometric functions. Young scholars consider two sine functions and write three functions that will lie between the two given. They use a graphing utility to assist in their explorations.
Concord Consortium
Sum and Product
From linear to quadratic with a simple operation. An exploratory lesson challenges learners to find two linear functions that, when multiplied, produce a given parabola. The task includes the graph of the sum of the functions as well as...


