Virginia Department of Education
Numbers in a Name
What's in a name? Pupils create a data set from the number of letters in the names of classmates. Each group then takes the data and creates a visual representation, such as a histogram, circle graph, stem-and-leaf plot, etc.
Curated OER
Games for Probability: In-Class and Powerball Simulation
Your soon-to-be statisticians play a game to understand the difference between independent and dependent experiments and probability. They draw colored cubes from a bag and then, by either replacing the cube in the bag, or not, for each...
Curated OER
Scatter Diagrams and Curve Fitting
In this Scatter Diagrams and Curve Fitting worksheet, students are guided in how to graph a scatter diagram (plot) and a Best Fit Line using a TI-83 graphing calculator.
Texas Instruments
Let's Play Ball with Families of Graphs
Learners explore quadratic equations in this Algebra II lesson. They investigate families of quadratic functions by graphing the parent function and family members on the same graph. Additionally, they write the equation of the parabola...
Curated OER
Creating Circles
Students make a circle graph. In this graphing lesson, the teacher conducts a class survey, then demonstrates how to make a pie graph. When students are comfortable with the material, they use a worksheet to create their own graph.
Curated OER
Data and Scientific Graphs
Students conduct experiments and graph their data. In this statistics lesson, students collect data and graph it on a coordinate plane. They analyze the data looking for patterns and they discuss their findings with the class.
Curated OER
Graphing Functions
In this graphing functions worksheet, students solve and complete 25 various types of problems. First, they evaluate each of the limits presented. Then, students graph each given function, graphing both the equation and then the...
Texas Instruments
Light and Day
Pupils explore the concept of collecting data as they collect data on their graphing calculator about time, temperature, and light. Learners plot the data and create histograms and box and whisker plots to analyze the data.
Curated OER
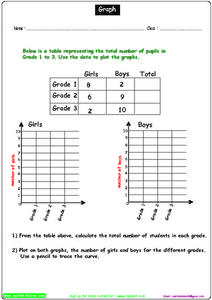
Graph Activity
In this graphing worksheet, students complete a data table, then use the data to draw a set of 2 graphs, calculate totals and plot numbers on both graphs.
Curated OER
Statistical Analysis for Graphing Calculators
High schoolers use data from the Chesapeake Bay to analyze temperature, phosphate, nitrates, salinity, and oxygen levels.
Lane Community College
Review Sheets: Trigonometry
Review guide, practice test, homework packet? Yes, yes, and yes as it's all possible with a wonderful trigonometry packet. Every type of problem is there, starting from the unit circle and ending with conic sections.
Utah Education Network (UEN)
Simplifying Exponential Expressions
This exponential expression resource has each of the class members determine the value of given exponential expressions. They use their calculator to find the values and identify patterns. Besides writing the numbers exponentially, they...
Curated OER
Intercepting Villans Using the Correct Rate
A Cyberchase video introduces the distance = rate x time equation. Participants then calculate answers to proposed problems and graph a series of results that is then incorporated into a game to help cement the concept. A thorough and...
Curated OER
Read and Write Numbers up to 100,000
Use this lengthy, and challenging, presentation in your lesson on numeracy. Pupils practice their skills in reading and writing numbers up to 100,000, interpret a variety of graphs, solve word problems, and get to use a calculator. A...
Curated OER
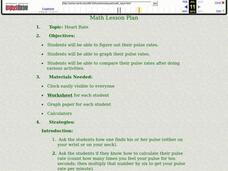
Graphing Heart Rates
Students take their pulse rates. In this graphing lesson, students take their pulse rates and graph them. Students do various physical activities and graph the differences in their pulse rates.
Curated OER
Polar Graphs
Students graph polar graphs. In this calculus lesson, students convert between polar and rectangular coordinates. They graph their solution on the TI calculator and make observations.
Curated OER
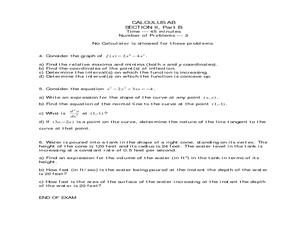
Calculus Exam
In In this calculus worksheet, student solve 6 multi-step problems involving volume, intervals, acceleration, and graphing. A graphing calculator will be necessary to complete the worksheet.
Curated OER
Graph Transforms
In this graph transforms learning exercise, 10th graders solve and complete 15 various types of problems. First, they evaluate each function and sketch the graph. Then, 10th graders determine why two transformation illustrated are...
Curated OER
Trigonometric Graphs
In this Trig worksheet, 12th graders identify and differentiate between trig graphs. They identify phase, translation and solve equations dealing with angles.
Curated OER
Solving a Pair of Linear Equations by Graphing
Teach your math lovers how to solve linear equations by graphing. Students identify pairs of coordinates and use it to graph a line and use the TI to graph and observe the line.
Texas Instruments
Data Collection for Bar Graphs
Learners study the concept of central tendency in this data collection for bar graph lesson. They collect data outside as instructed and organize it into a bar graphs, then they list in specific groups the labels that appear on the...
Curated OER
Concavity of a Graph
Learners explore the graph of a function. For this calculus lesson, students identify when and where the graph is increasing or decreasing. They identify if it concave up or down by moving the cursor.
Curated OER
Math is Everywhere!
For this everyday math skills pretest, learners answer ten multiple choice questions based on their knowledge of everyday math skills such as estimation, addition, and measurement.
Curated OER
Graph Logarithms
Mathematicians graph logarithmic equations. Teach your students how to identify the intercepts of logarithmic equations and tell whether the function is increasing or decreasing. They find the domain and range of each function.


