Curated OER
Solve Multistep Equations
In this multi-step equations instructional activity, 9th graders solve and complete twenty-four different problems that include using a graphing calculator to complete. First, they solve for x in the first section. Then, students solve...
Curated OER
Data Collection and Graphing
Students collect data and graph it on a coordinate plane and analyze it. In this statistics instructional activity, students display their data collection using a graph. They determine which central tendency will work best.
Curated OER
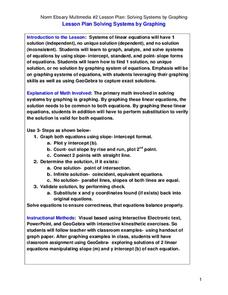
Solving Systems by Graphing
Students solve systems of equation through graphing. In this algebra lesson, students solve linear equations and analyze the result to figure out if there is one solution, no solution or infinitely many solutions. They graph their lines...
Curated OER
Solving Systems by Graphing
Solve systems of equations with your super smart upper graders. They solve systems of equations and then graph two lines to find where they intersect. The focus on the activity is to have learners explore moving a point to...
Curated OER
M&Ms; Line Plots and Graphing
Students, using small individual bags of M&Ms, engage in activities including; estimating, sorting, graphing, mean, median, mode, fractions, percentage, and averaging.
Curated OER
Build a Skittles Graph
Students construct a bar graph with a given set of data. They calculate the ratio and percent of the data. Students discuss alternate ways of graphing the data as well as multiple strategies to approach the task.
Curated OER
Using Excel To Teach Probability And Graphing
Students engage in the use of technology to investigate the mathematical concepts of probability and graphing. They use the skills of predicting an outcome to come up with reasonable possibilities. Students also practice using a...
Curated OER
Graph the Presidents At Inauguration- How Old Were They?
Students construct a graph of the presidents' ages at inauguration. In this U.S. history instructional activity, students use online resources to gather data about the presidents and accurately present their results on a graph.
Curated OER
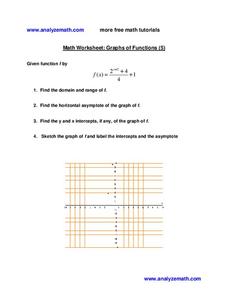
Graphs of Functions
In this algebra instructional activity, 11th graders calculate the domain, range, asymptote and intercepts of a quadratic function. They sketch the graph and identify the transformation. There are 4 questions in this instructional activity.
Curated OER
Graphs
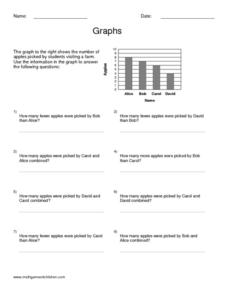
In this graphs worksheet, students find the mid-point of a line and identify its coordinates. This six-page worksheet contains 7 multi-step problems. Explanations and examples are provided. Answers are located on the last page.
Curated OER
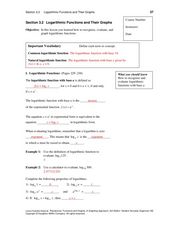
Logarithmic Functions and Their Graphs
In this algebra worksheet, students evaluate, graph and solve logarithmic functions. They rewrite log functions and identify different log properties.
Curated OER
Graphing Surveys and Analyzing Data
Young scholars analyze data and graph the results of their surveys. In this statistics lesson plan, students create graphs using excel to make graphs to be able to better observe their data. They conclude how great we as unique individuals.
Curated OER
Graphs
In this algebra worksheet, students calculate the point of intersection between a circle and a straight line. There are 5 questions with an answer key.
Curated OER
Calculate Rates Using Appropriate Units
In this Algebra I/Algebra II worksheet, students solve verbal problems in which they calculate the indicated rate and choose the appropriate unit of measurement. The three page worksheet contains a combination of nineteen multiple...
Curated OER
Graphing Functions
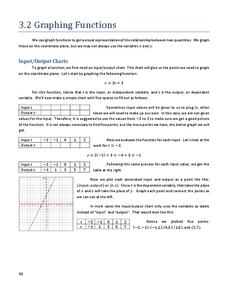
For this graphing functions worksheet, students write functions in logarithmic and exponential forms. They evaluate logarithms and determine the inverse of a function. Students graph functions. This six-page worksheet...
Curated OER
American Indian Flute and Math
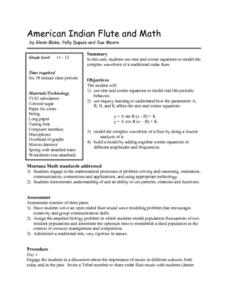
Students investigate the Math behind Musical instruments in this cross-curricular Math lesson on the Native American Flute and waveforms. The lesson can be accomplished in 6 days and includes an extensive materials list for successful...
Curated OER
Prime Time Math: Emergency
Eighth graders, while using Prime Time Math: Emergency software, use math and medical data to participate in the diagnosis of a girl. Just like the medical team in the story, they will be using math to respond to a medical emergency- a...
Curated OER
Limits with a Calculator
Pupils investigate Limits using a graphing calculator or TI. In this calculus lesson, students solve limit problems through modeling and relation to the real world. They use correct notation and solve problems involving more than one step.
Curated OER
Box and Whiskers
Middle schoolers discover how to relate collected data with a box and whiskers graph in a number of formats. They collect, organize, create, and interpret a box and whiskers graph. Pupils interpret the difference between sets of data,...
Curated OER
The Way to Better Grades!
Pupils collect and analyze data. For this statistics lesson, learners create a scatter plot from their collected data. They use, tables and graphs to analyze the data and mae decisions.
Curated OER
Long Distance Phone Plans
In this long distance phone plane worksheet, students compare various phone plans and determine which long distance plan has the greatest savings. Students support their answers visually through the use of tables and graphs. They write...
Curated OER
Solving Systems of Equations
Learners explore the concept of solving systems of equations with two equations and two unknowns. In this solving systems of equations lesson, they work through problems of solving systems by substitution, elimination, and graphing....
Curated OER
Why Doesn't My New Shirt Fit?
Students test Leonardo da Vinci's view of the human body by measuring various body parts using a tape measure. They create a data table and a scatter plot and then analyze and interpret the results using a graphing calculator.
Kenan Fellows
Density
Most scholars associate density with floating, but how do scientists determine the exact density of an unknown liquid? The third lesson in a seven-part series challenges scholars to find the mass and volume of two unknown liquids. Each...


