Curated OER
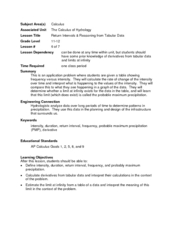
Return Intervals & Reasoning from Tabular Data
Students calculate derivatives from a set of data. For this calculus lesson, students estimate the limit at infinity. They complete a Return Interval handout at the end of the lesson.
Curated OER
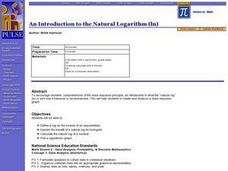
An Introduction to the Natural Logarithm (ln)
Students explore the dose response principle, an introduction to what the "natural log" (ln) is and how it behaves. They create and analyze a dose response graph.
Curated OER
The Slope of a Curve
Students graph the slopes of a line using the intercepts. In this precalculus lesson, students identify the properties of a curve slope. They find the limit and use a graping calculator to graph their lines.
Curated OER
Introduction to Solving Quadratic Equations by Factoring
Pupils solve quadratic equations. In this algebra lesson, students factor and graph linear and quadratic functions. They identify the standard and linear form of each equation.
Curated OER
From Playing with Electronics to Data Analysis
Students collect and Analyze data. For this statistics lesson, students identify the line of best fit of the graph. They classify lines as having positive, negative and no correlation.
Curated OER
Get a Half-life!
Students explore decay functions and the half-life of a substance. Through an M&M activity with calculators, students collect and graph data. They determine the linear, quadratic and exponential functions of the graph. Students...
Curated OER
Finding the Vertex of a Quadratic Function
Students solve quadratic equations and identify the vertex. In this algebra lesson, students factor quadratic equations and identify the different properties of a parabola. They graph the functions using the vertex and intercepts.
Curated OER
Radical Transformations
Students transform the square root function graphically. In this transforming the square root function graphically lesson, students use their Ti-Nspire to change the a, b, and c values of th square root graph. Students...
Curated OER
Connections Involving Linear And Quadratic Functions
In this math worksheet, students determine the range of the function. Then they graph the functions while finding the coordinates on the plane.
Curated OER
Probability
Students investigate probability. In this fourth through sixth grade mathematics lesson, students collect, organize and display data in an appropriate chart or graph as they calculate and apply basic probability.
Curated OER
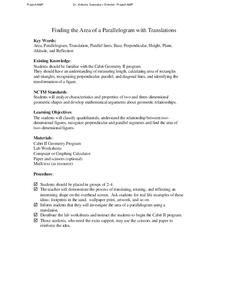
Finding the Area of a Parallelogram with Translations
Students calculate the area of a parallelogram. In this geometry lesson, students perform translation using a coordinate plane and coordinate pairs. They perform translation on other polygons.
Curated OER
Finding the Area of a Parallelogram with Translations
Students calculate the area of parallelograms. In this geometry lesson, students identify properties of parallelograms and use to to solve problems. They create polygons using Cabri software.
Curated OER
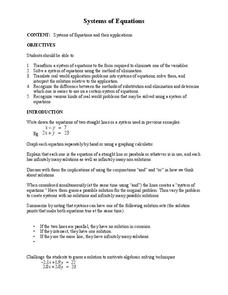
Systems of Equations
Students solve systems of equations. In this algebra activity, students use elimination and substitution to solve for the point of intersection. They use graphing to see where the two lines intersect.
Curated OER
Bon Voyage Math
Sixth graders investigate the cost of throwing a party. In this cost of throwing a party lesson, 6th graders have to throw a going away party for 2 exchange students given a $350 budget. Students work in groups to determine...
Curated OER
If you have to find the area of a region, how would you calculate it?
Fifth graders find the area of rice farms. In this area lesson, 5th graders draw shapes and grid them to find the area. They compare different rice fields to see which one takes up more space and has the larger area.
Curated OER
Exploding Numbers
Students discuss how numbers increase when exponential growth is occurring. They view a video and compare exponential and linear growth with a graphing calculator.
Curated OER
Chaos and Fractal Applications
Eighth graders identify the different applications of fractals. In this math lesson plan, 8th graders use graphing calculator to solve algorithms. They explain how changing parameters and initial conditions affect the solutions.
Curated OER
Visual Representation of Reduced Fat
Students demonstrate their understanding of the Five-Number Summary and Box-Plots by analyzing different nutrition labels from regular and reduced fat items using graphing calculators.
Curated OER
Linear Progression
Students use graphing calculators to graph lines and create tables of values. They perform an experiment using M&M's and slinkys, then create their tables based on their results.
Curated OER
Walking Home
Students discover the formulas for calculating distance. In groups, they solve equations determine the distance in a specific amount of time. They record their answers in a chart or graph and compare them with their classmates.
Curated OER
Sound Pictures
Students examine the components of a sonar system. In this physical science instructional activity students explain how multibeam and sidescan sonar systems are useful to ocean explorers. Students simulate sonar operations in an...
Curated OER
Lift vs. Airspeed
Students, after reading the explanation given below, use FoilSim and a graphing calculator to complete the activity to determine the relationship between airspeed and lift of an object by interpreting data.
Curated OER
Lift/Velocity Relationship Problem Set
Students, after reading an explanation from a NASA Web-based textbook, demonstrate their ability to use, graph (using a graphing calculator), and interpret a text equation.
Curated OER
Random Number Generators And Probability, Will the Wings Win??
Young scholars participate in probability experiments and simulations while modeling and solving problems. They examine how to use the random number generator on a graphing calculator using examples from their local hockey teams.


