Curated OER
Proof of the Pythagorean Theorem Using Transformations
Middle and high schoolers construct a triangle using Cabri Jr. They construct squares on each of the legs and hypotenuse of the triangle. Pupils show that the area of the squares on the leg equal the area of the square on the hypotenuse.
Curated OER
Dilations in the Plane
Tenth graders investigate dilations and explore the dilation transformation before investigating the properties of a dilation using Cabri Jr. High schoolers extend the concept of dilatation to the coordinate plane.
Curated OER
Historical Mathematicians Project
Students, in small groups, use the Internet and other traditional sources to research historically significant mathematicians, write a paper, and creatively present research in class.
Curated OER
Betweenness and the Sum of Parts
High schoolers differentiate lines and angles using betweenness in this geometry instructional activity. They differentiate angles and lines using Cabri Jr. and analyze the data and make conjecture.
Curated OER
Pay Check Advance Loan
Students research loans. For this financial lesson, students explore the benefits and drawbacks of applying for a pay-day advance loan. Students compare different programs and calculate interest owed. Multiple resources are provided.
Curated OER
Slope
Students graph lines and identify the slope. In this algebra lesson plan, students graph a line using y=mx+b and graph lines that are horizontal or vertical. They calculate the slope of the line using two points, and identify lines by...
Curated OER
Systems of Inequalities
Students solve and graph a system of inequality. In this algebra lesson, students calculate the solution of a system through graphing. They test their coordinate pair and shade on the correct side of the line. They review rules for...
Curated OER
Popular Paper
Learners explore the benefits of recycling paper. In this recycling lesson, students use statistics to calculate the amount of paper that is thrown away each week and construct a graph. Learners analyze the data and calculate the...
Curated OER
Shortest Path
High schoolers explore an application of definite integrals. They graph three functions that go through the same three points. Learners use the symbolic capacity of their calculators to find the shortest path through the three points and...
Curated OER
Jelly Bean Egg Challenge
Students each receive a plastic egg filled with jelly beans. In this Jelly Bean Egg Challenge, students estimate and weight their eggs, they count the number of jelly beans inside their egg, they chart their data and compare their data...
Curated OER
Mean Median and Mode
Young scholars collect data, graph it and analyze it. In this statistics lesson plan, students plot their data and calculate the mean, median and mode explaining how it relates to the data. They define the ways to find the mean, median...
Curated OER
Heart Smart in a Heart Beat
As an introductory activity, young statisticians measure their heart rate at rest and after exercise and compute the mean and median, and create a box & whisker plot. This is followed by watching a video (that no longer seems...
Curated OER
M&M Caper
Pupils participate in a game with M&M's to be introduced to percents and ratios. Individually, they estimate and record the number of candies they believe the bag holds and the amount of each colored candy. They open the bag and...
Curated OER
Consistent Circles
Students create a design of a circle. In this geometry lesson, students identify the measure of the diameter and radius of a circle. They graph and analyze their collected data and write equations based on direct variation.
Curated OER
Electromagnets: Winding Things Up!
Students explore solenoids and electromagnets. After building an electromagnet, students use a TI Graphing calculator, a CBL 2 interface and a magnetic field sensor to measure the strength of a magnetic field. They create a graph of...
Curated OER
World Population Study
Students explore an exponential relationship and how it relates to human population growth and the current global population crisis. They graph both exponential and linear information.
Curated OER
Diffusion & Osmosis with Data Analysis
Young scholars explore principles governing diffusion and osmosis. Students perform a dialysis tubing experiment. They obtain core samples of potato in varying concentrations of sugar-water to measure water potential of the potato...
Curated OER
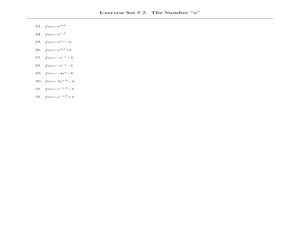
The Number "e"
In this college level mathematics worksheet, students explore the number e and graph functions involving e. The two page worksheet contains thirty-two problems. Answers are included.
Curated OER
He Came Out Of Nowhere!
Students calculate the traveled speed and distance of a robot. In this geometry lesson, students use the distance formula to manipulate and use to solve for the required variable. They calculate answers where two variables are...
EngageNY
Comparison Shopping—Unit Price and Related Measurement Conversions II
Which rate is greater and by how much? Pupils continue to compare rates to solve problems in the 20th portion of a 29-part series. Rates are presented in a variety of representations either using the same representation or different...
Curated OER
Who Gave It to You?
Students use logic to locate the primary cases, the people who started the spread of the disease through the population. They graph the data of the number of people infected over time (exchanges) and determine an equation that best fits...
Curated OER
Positive Future Fair Project
Ninth graders view the film "Pay It Forward" and discuss what kind of public campaign is needed to move people to positive action. They consider different ways of presenting information (graphs, visual displays, etc.) as tools for...
Curated OER
Where am I Located
Students calculate and find a certain location. In this geometry instructional activity, students examine a coordinate plane for pair of coordinates. They calculate the distance between point using the distance formula and estimation.
Curated OER
Disease Lesson
Ninth graders examine rates, matrices, histograms, line graphs, data analysis and data presentation in order to develop an understanding of how these concepts apply to a the effects of a specific disease.


