Curated OER
Stretching the Quads
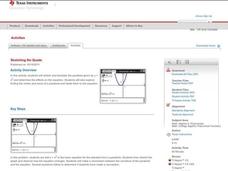
Scholars investigate transforming parabolas. In this transforming parabolas lesson, they take the parent graph y=x^2 and transform it by shifting left, right, up, and down and shrinking and stretching. The class finds maximums,...
Curated OER
Murder in the First Degree - The Death of Mr. Spud
Secondary learners investigate exponential functions in a real-world scenario. They collect data on the temperature of a cooling baked potato, enter the data into lists, and graph the data using a scatter plot before finding an...
Curated OER
Quadratic Equations with the CBL 2
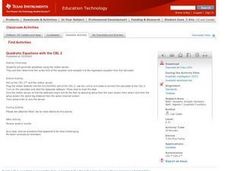
Learners practice generating parabolas with a motion sensor while determining the vertex form of the equation. They compare it to the regression equation from the calculator onto a data mate software. Each student completes several...
Curated OER
Math: Will The Airplane Get Off the Ground?
Students use data from real-life models to calculate and compare the force required for an airplane of a given weight to become airborne. They use a graphing calculator to evaluate data and use the World Wide Web to access data.
Curated OER
Explore Graphs and Factors
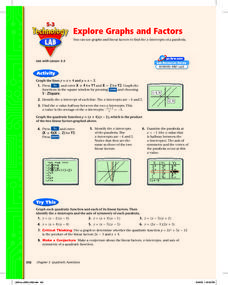
Pupils graph the factors of a quadratic as linear equations and graph the parabolic equation in factored form. Also, they investigate the relationship between the x-intercepts of the lines and the zeros of the parabola.
Curated OER
Wacky Water World: Student Worksheet
In this math worksheet, students will work alone or in pairs to determine which theme park ticket package is a better deal. Students will use data provided in the worksheet and a graphing calculator to make the decision.
Curated OER
Exploring Graphs of Inequalities
Learn how to solve inequalities and graph their answers. Students use addition, subtraction, multiplication and division to solve problems. They analyze their graph using the TI calculator.
Curated OER
Application of Graph Theory
Students investigate different online tutorials as they study graphing. In this graphing instructional activity, students apply the concept of graphs cross curricular and use it to make predictions. They define the purpose and theories...
Curated OER
Graphing Using Excel
Fifth graders complete a series of graphs by gathering information and using Excel to graph the information. In this graphing lesson, 5th graders graph favorite desserts of the class. Student put their results into the...
Curated OER
Creating a Spreadsheet and Graph
Students create graphs in Excel. In this spreadsheet lesson, students input data into spreadsheet cells then use the graphing feature of the Excel program to produce colorful graphs of the data. The directions to create the...
Curated OER
Math TODAY for TI-Navigator System - Humidity Makes Air Feel Even Hotter ? Part II
Learners explore quadratic and cubic functions that will model the relationship between air temperature and heat index at fixed relative humidity values. They also make generalizations and apply the findings using their TI-83 Plus or...
Curated OER
Digger and the Gang
Help online friends Digger and Sprat from the BBC series to solve math problems! In a series of activities, your class will use data sets to calculate measurements, averages, means, and probabilities. The class completes worksheets and...
Curated OER
Graphing and Interpreting Linear Equations in Two Variables
Graph linear equations using a table of values. Learners solve equations in two variables using standard form of an equation. They identify the relationship between x and y values.
Curated OER
Graphing Quadratic Equations
Review the form of a quadratic function, and the parabola it creates. Continue on with the whole group to work through a mini-lab, practicing how to graph quadratic equations with one variable. The goal of this lesson is for the group...
Curated OER
Curve Fitting and the TI-85 Calculator
Seventh graders follow a step-by-step guide for using graphing calculator to determine equations which best fit data graphed. They gather data from various sites on the web, or they do searches to find information necessary to complete...
Curated OER
Graphical Analysis
Get out your TI-nspire graphing calculator and explore polynomials. Learners determine where a given polynomial are increasing or decreasing, find maximums, minimums, and zeros of polynomials, and discuss end behavior of polynomials....
Curated OER
Stretching the Quads
Explore parabolas in this algebra lesson with the graphing calculator. The class investigates what effects the changing of the parameters of the vertex form of a quadrati have to its graph. They find the zeros of a quadratic graphically...
Curated OER
Another Way of Factoring
Focusing on this algebra lesson, learners relate quadratic equations in factored form to their solutions and their graph from a number of different aspects. In some problems, one starts with the original equation and finds the...
Curated OER
Linear Programming
Students explore inequalities to determine the optimal solution to maximize a profit for a company. In this linear programming lesson plan, students discover how to graph inequalities and how to determine the algebraic representation of...
Virginia Department of Education
Organizing Topic: Data Analysis
Learners engage in six activities to lead them through the process of conducting a thorough analysis of data. Pupils work with calculating standard deviations and z-scores, finding the area under a normal curve, and sampling...
Polar Trec
How Much Data is Enough?
The next time you read a magazine or watch the news, make note of how many graphs you see because they are everywhere! Here, scholars collect, enter, and graph data using computers. The graphs are then analyzed to aid in discussion of...
Curated OER
Watch Your P's and Q's
Using your graphing calculator, find all the rational zeroes of a polynomials by using the Rational Zero Theorem. Divide polynomials using the Remainder Theorem and the Factor Theorem and then graph it to find the number of real roots.
Curated OER
Complex Numbers
The class practices, on paper and/or on a TI graphing calculator the concepts of how to add, multiply, divide and subtract complex numbers using the correct property.
EngageNY
The Binomial Theorem
Sometimes, there is a better way. Scholars develop Pascal's triangle as a method to arrive at the coefficients of binomial expansions as an easier method to expand binomials. The learners connect the formula for binomial coefficients to...


