Delegation of the European Union to the United States
The Geography of Europe
What is the European Union? Where is it? Why is it? To begin a study of the EU, class members examine the physical geography of Europe and the size and population density of 28-member countries in comparison to non-member countries...
EngageNY
Finding One Hundred Percent Given Another Percent
Class members solve problems to find the whole when given a percent. They use double line numbers and factors of hundred to help break the 100 percent into equal segments.
Curated OER
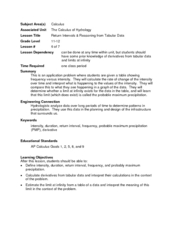
Return Intervals & Reasoning from Tabular Data
Students calculate derivatives from a set of data. For this calculus lesson, students estimate the limit at infinity. They complete a Return Interval handout at the end of the lesson.
Curated OER
Converting Fractions to Decimals
Seventh graders take a simple fraction and give it decimal form either by the use of equivalent fractions or division with a calculator.
Curated OER
Slippery Slope
Middle schoolers use a computer to complete activitites about slope. They find the slope of mountains, roofs, and stairs using rise over run. Pupils are shown different types of slopes and have to identify if the slope is positive,...
Curated OER
Disease and Epidemics
Explore how the study of diseases and epidemics can be comprehended from a mathematical perspective. Investigate finite geometric series, calculating threshold values, and statistical models of the spread of disease. How many makes it an...
Curated OER
"You're Hired!'
Students investigate linear programming using the TI. For this algebra lesson, students collaborate and graph linear inequalities on a TI. They analyze their data and present it to the class.
Curated OER
Off to College
High schoolers investigate linear, quadratic and exponential equations using the TI calculator. They identify relation and functions using ordered pairs, graph the data, analyze the data, and relate it to real-world situations.
Curated OER
Fun with Math using Magnetic Force
Sixth graders explore and discuss the effectiveness of magnets in different situations. For this math lesson, 6th graders discuss rate and graphs after exploring with magnets using different restrictions on the magnets. They analyze...
Curated OER
Box Plots
Young statisticians are introduced to box plots and quartiles. They use an activity and discussion with supplemental exercises to help them explore how data can be graphically represented.
Curated OER
Does Sunlight Effect Leaf Size?
Students make estimates and then measure leaves for accuracy. They calculate the area of the leaves by drawing an outline on graph paper and counting the squares. They compare the leaves exposed to sunlight to those that are in constant...
Curated OER
Data Analysis of Ground Level Ozone
Sixth graders construct and interpret graphs from ozone data collected in Phoenix area. Can be adapted to other areas.
Curated OER
Antarctica’s Melting and the Affect it has on the Ocean
High schoolers calculate how much mass is lost and gained by Antarctica yearly. In this earth science lesson, students graph and analyze data from the given handout. They explain how this affects the world climate.
Curated OER
Capture/Recapture
Students use proportions to estimate the size of populations. They describe the data with using a graph or table of the estimate. Students use descriptive statistics to calculate mean, median, and mode. They also compare and contrast an...
Curated OER
Take Your Medicine 2
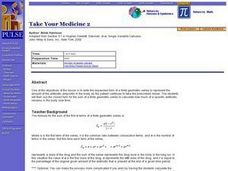
Real-world application of the finite geometric series. Sick? Need to take Ampicillin? How much is in the body at any given point in time as this medication is taken over the course of time. Use the formulas, make calculation, and graph...
Curated OER
Stick-Slip Movement
Ninth graders operate a model to observe the type of motion that occurs at a fault during an earthquake. They explore the effects of several variables. Students measure movement, calculate averages and plot and graph information.
Curated OER
Fishing for Points
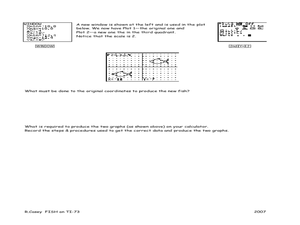
Learners explore the concept of ordered pairs. In this ordered pairs lesson, pupils list the ordered pairs of a graph in the shape of a fish. They use their calculator to translate the fish using lists, then translate the fish left,...
Curated OER
Pumpkin Problems
Students participate in a instructional activity that has the intention of working on estimation skills. They use pumpkins to estimate the number of seeds are inside. They collect data for each pumpkin and compare it to the estimation....
Curated OER
Buying a Car
Eighth graders create spreadsheets to calculate payments. They create a list of items they would like to purchase that require monthly payments. They simulate buying a car and create a spreadsheet to determine the amount of the monthly...
Curated OER
Shopping the Sunday Circular
Pupils demonstrate an understanding of price-per-unit mathematics. In this computation lesson, learners accurately figure the unit price of grocery items. They create a chart and record the item, the price, the size and the cost per item.
Curated OER
Two-Variable Linear Inequalities
Here is an engaging lesson on solving equations with two variables. Have the class rewrite linear equations in the slope intercept form, y=mx + b. They graph the lines using the slope and y-intercepts.
Curated OER
Mean Absolute Deviation in Dot Plots
The lesson focuses on the ideas of dot plot representations and the mean absolute deviation of data sets.
Curated OER
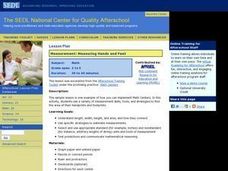
Measurement: Measuring Hand and Feet
Here is a good lesson which invites learners to practice measurement using standard and nonstandard measuring tools. In this measurement lesson, learners work with length, width, height, and area. They use standard and nonstandard...
Curated OER
Linear Modelling of the Life Expectancy of Canadians
Middle and high schoolers explore the concept of linear modelling. In this linear modelling lesson, pupils find the line of best fit for life expectancy data of Canadians. They compare life expectancies of men and women, and find...


