Curated OER
All About Me: Measuring Height and Weight
Learners take personal fitness inventories. In this personal health lesson, students take measurements of their heights and weights. Learners record the data, calculate their BMI, and then chart their physical activity.
Curated OER
Wildlife
The centerpiece of this lesson plan is a predator-prey simulation in which colored paperclips represent different species of animals camouflaged against a colored background. Relevant follow-up questions are provided. The activity is...
Curated OER
See Turtles Nest! See Turtles Hatch!
Students graph data of sea turtles hatching rates from Watamu/Malindi Marine National Park and Reserve in Kenya. In this math lesson, students use real life science data to calculate mean and median values. Students use...
Curated OER
Frame Yourself
Young ratio masters calculate and cut a frame (out of poster board) to accurately create an even frame around a picture of themselves. The frame needs to be proportional to the picture with constraints determined by the instructor.
Curated OER
Environment: Water & Air
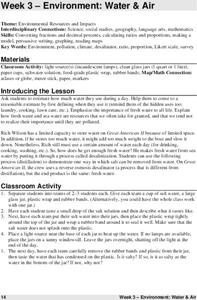
The introduction to the lesson mentions a sailor's limited capacity to store drinking water on his ship. Pupils then set up an overnight experiment to remove freshwater from salt water by distillation. There is a math and map activity to...
Curated OER
Louisville's Best Field Day Park
Students create a survey to hand out to determine the best field day park. Using their local area, they select five parks, if possible, that meet the criteria and calculate the distance and estimated time travel. They use this...
Curated OER
Equations from Unit Rates
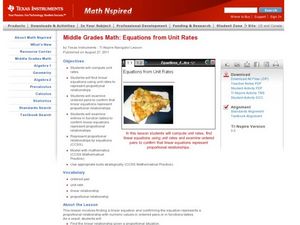
Your class can become linear equations masters, as they calculate the rate of change of a function. They observe different types of coordinates as they relate to a graph, then use the Ti-navigator to move the line around and draw...
Curated OER
What is the Rock Cycle and Its Processes?
Geology beginners examine three different rock samples and determine their origin by their characteristics. By making and recording observations, they become familiar with features of igneous, metamorphic, and sedimentary rock types....
Curated OER
Reading & Using a Nutrition Label
Students discover the importance of healthy eating. Using food nutrition labels, they read and examine the nutritional value. Students collect the data on a spreadsheet and create a graph. They analyze the media influences on product...
Curated OER
Marvelous Mathematics
Learners make a table on the computer, but create fractions and equivalent fractions through the use of color. They are able to manipulate fractions in order to gain a greater understanding of the meaning of whole number that is broken...
Curated OER
Linear Progression
Students use graphing calculators to graph lines and create tables of values. They perform an experiment using M&M's and slinkys, then create their tables based on their results.
Curated OER
Chaos and Fractal Applications
Eighth graders identify the different applications of fractals. In this math lesson plan, 8th graders use graphing calculator to solve algorithms. They explain how changing parameters and initial conditions affect the solutions.
Curated OER
Sound Pictures
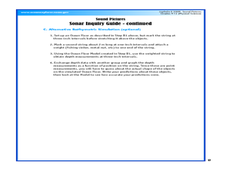
Students examine the components of a sonar system. In this physical science instructional activity students explain how multibeam and sidescan sonar systems are useful to ocean explorers. Students simulate sonar operations in an...
Curated OER
Slopes, Distances, and Map Keys
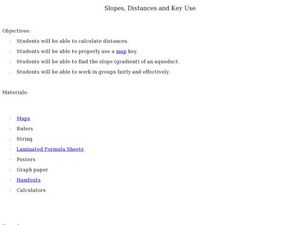
Students explore Rise and Run. In this math lesson, students use Rise and Run to find given slopes, they will use the slopes to calculate distances from point to point on graph paper.
Curated OER
Bacteria Buddies
Tenth graders grow two different bacteria cultures. They count the colonies, and then use graphing calculators to predict the number of colonies that are going to appear. Students answer questions from their worksheet after completing...
Curated OER
Introduction to Limits
Twelfth graders problem solve limit/function value situations. They solve the problems using a graphing calculator, which allows them to see the function's graph, and infer the function value and limit from the graph.
Curated OER
Random Number Generators And Probability, Will the Wings Win??
Young scholars participate in probability experiments and simulations while modeling and solving problems. They examine how to use the random number generator on a graphing calculator using examples from their local hockey teams.
Curated OER
M&M Exponential Activity
Students create a scatter plot of their experimental data. In this algebra lesson, students use M&M's to determine an algebraic model. They discuss results in class.
Curated OER
TI-83 Tutorial for statistics
Students learn the uses of the TI-83 calculator for statistical operations.
Center of Excellence for Science and Mathematics Education
A Sick Astronaut
Aspiring astronauts graph, interpret, and analyze data. They investigate the relationship between two variables in a problem situation. Using both graphic and symbolic representations they will grasp the concept of line of best fit to...
Curated OER
Charting Historical Gas Prices
Students investigate the historical and current prices of a gallon of gasoline. Using an online tool, they calculate the inflation-adjusted cost of gasoline over the years, and create a graph to demonstrate the actual cost vs. the...
Curated OER
Solving Systems of Equations
Students identify the quadrants and axis of a coordinate plane. In this algebra lesson, students discover the ocrrect way to graph using the coordinate plane. They discuss the relationship between x and y values, domain and range and...
Curated OER
Transforming Snoopy Using Coordinates
Students graph coordinate points to create a picture of Snoopy. In this coordinate point lesson, students read a book and learn about Rene Descartes' invention, the coordinate grid. Students graph a surprise picture on...
Curated OER
Transformations and Exponential Functions
Tenth graders study graphing exponential functions. In this transformations lesson, 10th graders apply inquiry to determine how changes to a parent function affect its graph. Students analyze transformed graphs and generate the function...


