Texas Instruments
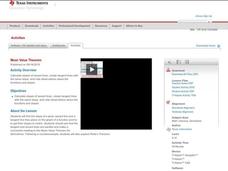
Mean Value Theorem
Students calculate the slopes of secant lines. In this calculus lesson, students graph tangent and secant lines using the coordinate plane. They use the Ti calculator to graph and observe the lines.
Curated OER
Standard Form of Equations
Learners complete the square and identify different parts of a quadratic equation. In this algebra lesson, pupils graph conics using the TI calculator. They rewrite equations by completing the square.
Curated OER
Filling The Urn
Learners calculate the area under a curve. In this calculus lesson,students calculate the area by integrating the equation. They calculate the volume of cylindrical shapes created between graphs.
Curated OER
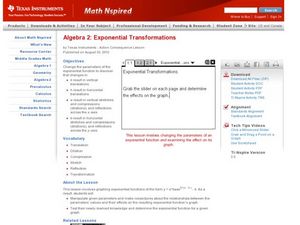
Exponential Transformations
Perform transformations on exponential functions! Teach your class how to perform dilation, compression, and translation. They graph exponential functions using the TI Calculator.
Curated OER
Global Statistics
Students determine statistics based on data. In this statistics lesson, students use data and record in charts. Students create graphs based on the statistics found.
Texas Instruments
Buying Your First New Car!
Learners explore exponential growth and decay using M&M’s in this Algebra II/Pre-calculus lesson. They investigate the cost of a new car by calculating depreciation and payments.
Curated OER
Critical Points
Students identify critical points on a graph. In this calculus lesson plan, students graph their equations on the TI calculator. They zoom in and out to identify the critical points.
Curated OER
Solids of Revolution - Disks
Young mathematicians solve the volume using the disk method in this calculus lesson. They revolve a graph around the x-axis and calculate the volume. They use the TI to see the revolving around the x-axis and create a virtual cross...
Curated OER
Taylor Polynomials
Pupils graph Taylor polynomials in this calculus lesson. They observe the graphs for the expansion of Taylor polynomial functions and use the Ti calculator to help create visuals of the graphs.
Curated OER
Transformations of Functions 1
Learn how to solve problems with transformation. High schoolers perform transformation on their graphs. Then, they use the TI to create a visual of the graph as it is moving along the graph.
Curated OER
Logarithmic Transformations
Using the TI calculator to visualize and make predictions, students perform transformation vertically and horizontally on logarithmic graphs in order to solve problems.
Curated OER
Discriminating Against the Zero
Students explore the concept of quadratic equations. In this quadratic equations lesson, students find the roots or zeros of quadratic equations using the quadratic formula. Students give examples of functions with 2 real,...
Curated OER
Wrapping It All Up
Through learning how to examine linear, quadratic, and exponential functions, young scholars explore the effects of changes in parameters on the graphs of linear, quadratic, and exponential functions. The lesson plan is designed to...
Curated OER
Specific Heat of Air and Soil
Students are introduced to the concept of specific heat. In groups, they are given a set of data showing the temperatures of air and soil samples in which they calculate the ranges of the data. They identify whether the air or soil...
Curated OER
The Perfect Principal
Students demonstrate their understanding of math skills. In this data analysis lesson, students complete a worksheet requiring them to calculate mean, median, and mode, and create and interpret graphs. Lesson is intended as an assessment...
Curated OER
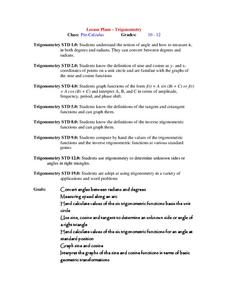
Trigonometry
Students investigate angles converting them from radians to degrees. In this trigonometry lesson, students work with angles and the six different trig ratios. They graph the functions representing each trig functions and identify the...
Texas Instruments
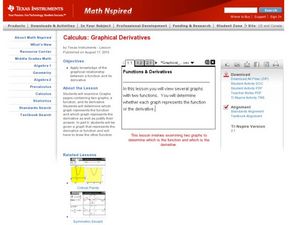
Graphical Derivatives
Pupils solve functions using the derivative. They determine the derivative of a function based on its graph, then analyze different functions and draw a relationship and conclusion based on the graph.
Curated OER
Characteristics of Exponential Functions
What can an upper grader do with an exponential function? They can solve and graph it, identify its important characteristic, and differentiate graphs based on shifts in graph bases that are greater or less than one. This 45 minute...
Curated OER
Exponential Functions f(x) = abx
Students define exponential functions and graph the equation. For this algebra lesson, students discuss exponential growth and decay as they graph their functions. They differentiate between the base of growth and decay.
Curated OER
Functions and Inverses
Students solve problems identifying the functions and inverses. In this algebra instructional activity, students identify a one-to-one function, and perform the horizontal line test. They analyze data and graph their results on a...
Curated OER
Exploring Power Functions 1
Learners describe the end behavior of polynomial functions. Pupils relate the behavior of the graph to the exponent of the graph. They differentiate graphs with odd-exponent and graphs with even exponents.
Curated OER
A Steep Hike
Students explore slope. In this middle school mathematics instructional activity, students analyze and interpret graphs as they investigate slope as a rate of change. Students use a motion detector to collect data as they...
Curated OER
Quick Stats with Quick Poll
Learners analyze data using bar graphs and the TI in this statistics lesson plan. They investigate quick polls and graph the data using different properties of statistics. This assignment requires a TI Navigator.
Curated OER
Straight Line Motion in Two Parts
Students describe and quantify the motion of toy cars. In this motion instructional activity, students observe a battery powered toy car on a flat surface and a standard toy car on a sloped surface. They write their observations, measure...


