Texas Instruments
A Tale of Two Lines
Students graph systems of equation. In this calculus lesson, students graph their lines on a TI calculator. They identify the point of intersection and the type of solution.
Curated OER
Natural Logarithm
Young mathematicians solve problems of logs and natural logs. They graph functions of natural logs on the TI and relate integrals to natural logarithms.
Curated OER
Euler's Method Introduction
Young mathematicians define and use Euler's method to solve problems in this calculus lesson. Learners visualize graphs and solve differential equations. They create these visuals on the TI calculator.
Curated OER
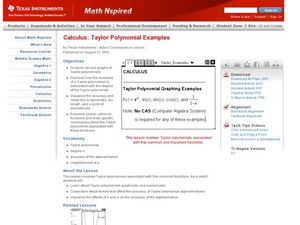
Taylor Polynomial Examples
Students graph Taylor polynomials. In this calculus lesson, students relate accuracy of a Taylor polynomial to the degree of the equation. They graph their polynomials using the TI calculator.
Texas Instruments
Convergence of Taylor Series
Students analyze taylor series for convergence. For this calculus lesson, students analyze the graph of a taylor series as it relates to functions. They use the TI calculator to graph and observe the different series.
Curated OER
Rate of Change
Students observe and calculate slopes. In this algebra lesson, students graph equations and determine the pace at which the slope is changing. They use the navigator to see the change as they graph the lines around.
Curated OER
Multiple Representations
Every topic or subject has its own special jargon. Learners work on their math vocabulary as it relates to basic algebra terms. They define and identify function, functional notation, ordered pairs, rate of change, slope,...
Curated OER
Exploring Transformations
Young scholars investigate functions and their transformations. They move absolute value functions around on the coordinate plane, and then define the transformation and plot the new graph. The table feature of the TI-calculator is used...
Curated OER
Discriminant Testing
The class works to identify solutions using the discriminant.They use part of the quadratic formula to find the number of solutions a quadratic equation will have. They calculate how-many times the quadratic function will cut the x-axis....
Curated OER
Parabolic Paths
Students investigate properties of parabolas. In this algebra lesson, students identify the different paths of a parabola. They use the navigator to make observations of the parabola.
Curated OER
How Many Solutions 2
High schoolers solve systems of equations. In this algebra lesson, students graph lines and identify the point of intersection. They identify the function to see if it is a function.
Curated OER
Approximation of Pi
Learners explore the concept of Pi. In this Pi lesson, students measure the circumference and diameter of a circle. Learners record the diameter and circumference measurements from their classmates. Students enter the...
Curated OER
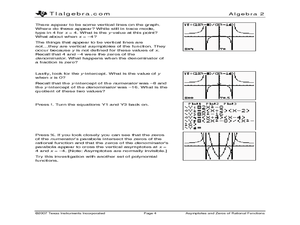
Asymptotes and Zeros
Learn how to explore rational functions and investigate the graphs rational functions and identify its singularities and asymptotes. Students approximate the solutions to rational equations and inequalities by graphing.
Curated OER
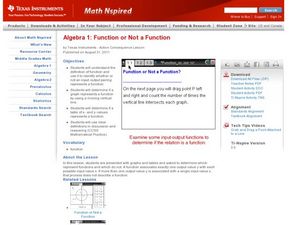
Function or Not a Function
Graphing linear equations on the TI is easy! Through examination of graphs and identification if it is a function or not, this instructional activity can relate to the real world.
Curated OER
Multiplicity of Zeros of Functions
Pupils identify the multiplicity of exponents as they graph polynomials. They write equations for a function given the zeros of the function and work backwards from solving equations.
Curated OER
The Price of Relief
Students calculate and graph the costs of essential items needed in Kosovar refugee camps on an individual, family, and camp basis. Additionally, students explore how relief organizations and businesses participate in relief efforts.
Curated OER
Exploring the Exponential Function
Learners collect and analyze data regarding exponential functions of the form y = abx. Students explore the affects of changing parameters on the graph of the function.
Curated OER
Weights of Objects
Students differentiate between the weights of an object on different planets. In this geometry lesson, students investigate different weights and graph their results as it relates to the different planets. They appreciate the design of...
Curated OER
Derivative Analysis
Students analyze the derivative of a graph. In this calculus lesson, students identify the different behavior of a graph. They label concavity of the graphs as increasing or decreasing.
Curated OER
Inclined Plane and Pulley
Students describe how inclined plane and pulleys make work easier. For this physics lesson, students calculate work done and mechanical advantage of both simple machines. They collect data from the experiment and construct graphs.
Curated OER
The Area of a Circle
Eighth graders find the circumference and diameter of several lids, show the relationship of the two measurements and derive the formula for finding the area of a circle. In this area of a circle lesson plan, 8th graders find...
Curated OER
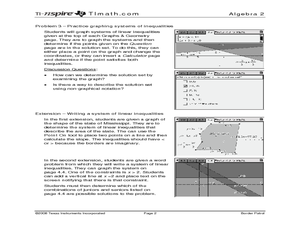
Border Patrol ID: 11603
Incorporate technology in your classroom by teaching your learners how to graph systems of linear inequalities as they apply to an area of land. The lesson plan provides an extension in which students are challenged to write a...
Curated OER
TI-Nspire Activity: What Does Your Representation Tell You?
By learning to select the best representation for three meal plans, students compare three meal plans to determine the best choice. Data for the meal plans is sorted on a table, as an algebraic equation, and graphed on a coordinate grid....
Curated OER
Systems of Linear Inequalities
The class solves systems of linear inequalities. They graph lines and identify the point of intersection.They graph lines and identify the boundary that represent the solution and solution set.


