Curated OER
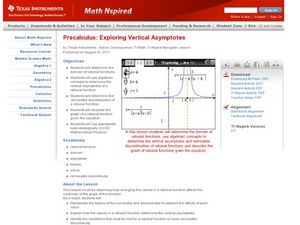
Exploring Vertical Asymptotes
Scholars identify the domain of a rational function in this precalculus lesson. They identify the removable discontinuity and label what will make the denominator zero. Learners also describe properties of the graph as it relates to the...
Curated OER
Music Favorites and Place Value
Fourth graders view CD ads and create a chart about an imaginary CD purchase. In this CD lesson, 4th graders calculate various cost connected with the CD's at the regular price and on sale. Students write a paragraph about the...
Curated OER
Local Linearity
In order to investigate local linearity, students graph the function on the TI-calculator and zoom to observe the change in slope on the line. They incorporate technology to visualize these problems.
Texas Instruments
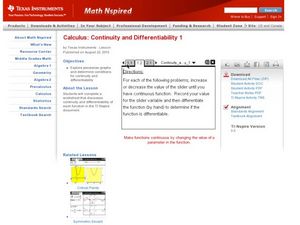
Continuity and Differentiability 1
Pupils examine graphs for continuity and differentiability in this calculus lesson. They observe piecewise functions to see where continuity and differentiability come into play. Learners finish by graphing their equation on the TI...
Curated OER
Riemann Rectangle Errors
High schoolers calculate the area under a curve. In this calculus lesson, students integrate the function to find the area under the curve. They use the Ti to create a visual of the graph.
Curated OER
Piecewise Linear Integral
Young mathematicians solve and graph piecewise functions in this calculus lesson. They integrate linear functions containing restrictions and graph their answers using the TI.
Curated OER
Exponential Functions and the Natural Logarithm
Students solve exponential and log functions. For this algebra lesson, students graph natural log and logarithmic functions. They compare and contrast between logs and the exponential graphs.
Curated OER
Cell Phone Range
Here is a 15 minute activity that can be used as review, a warm, or as a quick example of how to relate functions to the real world. Learners complete an application activity and draw conclusion about functions then discuss open and...
Curated OER
Comparing Linear and Exponential Functions
Teach your class how to differentiate between linear and exponential functions. They use exponential properties to solve problems, graph them using the TI-Navigator, and make comparisons.
Curated OER
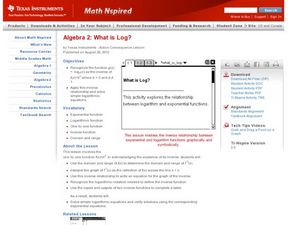
What is Log?
Young mathematicians differentiate between logs and natural logs in this algebra lesson. They solve functions and logarithmic functions. Learners also graph and rewrite the exponential and log functions.
Curated OER
Solving Logarithmic Equations
High schoolers solve logarithmic equations. They graph and plot logarithmic functions and use algebraic steps and the calculator to simplify and solve the equations.
Curated OER
Slow Down - Speed Up
Pupils explore the concept of distance and time as they use a CBR to mimic distance v. time graphs. Learners walk towards and away from the monitor to create various distance v. time graphs, then discuss what motion creates certain graphs.
Curated OER
Minimum and Maximum Perimeter
Pupils practice a variety of strategies with varying numbers of tiles to form shapes and then find the minimum and maximum perimeter for each one. Each group is assigned a different area to build either with square tiles or a geoboard....
Curated OER
Mean, Median, Mode and Range
Fourth graders investigate when to find the mean, median, mode and range. In this statistical concepts lesson, 4th graders collect data, make observations and graph the data. Students verify their work on the computer.
Curated OER
Conic Sections
Students explore the different properties of conics. In this algebra lesson, students calculate the midpoint of a line, the distances between two points as they get ready to find the focus and directrix in eclipse and other conics. They...
Curated OER
Power Function Inverses
Pupils graph polynomial functions and analyze the graphs. They identify the inverse of the functions and find the domain and range. Learners will then label the functions as one to one and use the horizontal and vertical line test to...
Curated OER
Pumped Up Gas Prices
Students calculate gas prices. In this transportation lesson, students tally the mileage and gas costs of their car for one months. They figure out how much was spent on gas and create a graph showing average gas prices over time.
Curated OER
New Kids in The Hall
Students assess the role of statistics in determining those athletes chosen to be inducted into the Baseball Hall of Fame. They work in small groups to calculate, chart, and graph various statistics for different Hall of Fame members.
Curated OER
Epidemic Proportions
Students research epidemics that have devastated world population at various points in history. They share and calculate statistics obtained in their research and develop graphs comparing and contrasting how different epidemics affect...
Curated OER
Approaching Limits
With the assistance of their Ti-84/Ti-83 Plus calculators, students develop a foundation for the limiting process as well as estimate limits from graphs and tables of values. They view how a function behaves as the input approaches a...
Curated OER
Border Patrol
Young scholars investigate systems of linear inequalities as they apply to an area of land. They practice graphing systems and determine if a point lies in the solution.
Curated OER
Standard Form of Quadratic Functions
Students factor quadratic equations. In this algebra lesson, students identify the factors and use them to graph the parabola. They find the parameters and vertex of each graph.
Curated OER
TI-89 Activities for PreCalculus and AP Calculus
Using the TI-89 calculator, high schoolers explore the statistical, graphical and symbolic capabilities of the TI-89. Students investigate topics such as solving systems of equations, finding inverse functions, summations,...
Curated OER
Mean Meadian and Mode
Learners apply central tendencies to given data. In this statistics instructional activity, students calculate the mean, median, and mode as it relates to their data. They collect data and graph it while identifying the way the numbers...


