EngageNY
Solving Exponential Equations
Use the resource to teach methods for solving exponential equations. Scholars solve exponential equations using logarithms in the twenty-fifth installment of a 35-part module. Equations of the form ab^(ct) = d and f(x) = g(x) are...
West Contra Costa Unified School District
Correlation and Line of Best Fit
Computers are useful for more than just surfing the Internet. Pupils first investigate scatter plots and estimate correlation coefficients. Next, they use Microsoft Excel to create scatter plots and determine correlation...
EngageNY
Perimeter and Area of Polygonal Regions in the Cartesian Plane
How many sides does that polygon have? Building directly from activity number eight in this series, learners now find the area and perimeter of any polygon on the coordinate plane. They decompose the polygons into triangles and use...
EngageNY
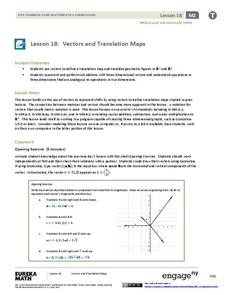
Vectors and Translation Maps
Discover the connection between vectors and translations. Through the lesson, learners see the strong relationship between vectors, matrices, and translations. Their inquiries begin in the two-dimensional plane and then progress to the...
Curated OER
Super Science By Any Means Necessary!
The animated S2 Unit will use the adventures of a Super Hero and her sidekick to teach basic science and math concepts. Educators can use comic books, Saturday Morning Cartoons and the adventures of Super Heroes to teach a nine-week...
Statistics Education Web
The Case of the Careless Zookeeper
Herbivores and carnivores just don't get along. Using a box of animal crackers, classes collect data about the injury status of herbivores and carnivores in the box. They complete the process of chi-square testing on the data from...
EngageNY
Modeling Relationships with a Line
What linear equation will fit this data, and how close is it? Through discussion and partner work, young mathematicians learn the procedure to determine a regression line in order to make predictions from the data.
EngageNY
Making Scale Drawings Using the Ratio Method
Is that drawn to scale? Capture the artistry of geometry using the ratio method to create dilations. Mathematicians use a center and ratio to create a scaled drawing. They then use a ruler and protractor to verify measurements.
EngageNY
Perimeter and Area of Triangles in the Cartesian Plane
Pupils figure out how to be resourceful when tasked with finding the area of a triangle knowing nothing but its endpoints. Beginning by exploring and decomposing a triangle, learners find the perimeter and area of a triangle. They...
EngageNY
When Can We Reverse a Transformation? 1
Wait, let's start over — teach your class how to return to the beginning. The first lesson looking at inverse matrices introduces the concept of being able to undo a matrix transformation. Learners work with matrices with a determinant...
EngageNY
Vectors in the Coordinate Plane
Examine the meaning and purpose of vectors. Use the lesson to teach your classes how find the magnitude of a vector and what it represents graphically. Your pupils will also combine vectors to find a resultant vector and interpret its...
West Contra Costa Unified School District
Interest and the Number e
Mary, Mary, quite continuously, how does your money grow? Uses examples to examine the difference between simple interest and compound interest, and to take a look at different rates of compounding. Learners explore what would...
Curated OER
Math Lesson: How Many People Live There?
Students are able to calculate the population density of a country, and calculate the population density of large cities in that country. They are able to create an appropriate graph to represent their data for that country.
Curated OER
Bones and Math
students identify and explore the connection between math and the bones of the human body. Students collect data about bones from their classmates and from adults, apply formulas that relate this data to a person's height, and organize...
Curated OER
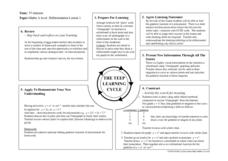
Math- A Level Differentiated Lesson
Students investigate the gradient function of a polynomial and they conduct a class discussion about its meaning. Then students use graphing software in order to examine tangents that can be seen visually to aid those who need visual...
Curated OER
What's Your Line?
Fifth graders collect temperature readings over a period of time, enter the information into a spreadsheet and choose the appropriate graph to display the results.
Curated OER
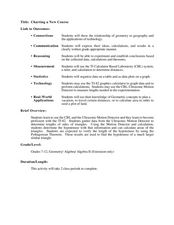
Charting a New Course
Students calculate the distance they will travel. In this geometry lesson, students use the TI and CBL system to make calculation of a certain path. They explore geography by calculating distances between different areas as it relates to...
Curated OER
Populations Lab - Exponential Graphing
Ninth graders investigate the application of populations that exists in one's everyday environment, in order to develop an understanding of how mathematics is a key component in the understanding of population dynamics.
Curated OER
Exploring the FTC using the TI
Students use the Fundamental Theorem of Calculus to solve problems. In this calculus lesson, students use the TI to solve the graphing porting of the problem. They practice graphing functions and discuss their place in the real world.
Curated OER
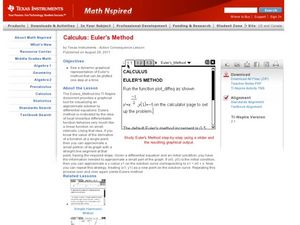
Euler's Method
Learners identify Euler's method of graphing in this calculus lesson. They approximate values of a function and check their work using EM. They also differentiate equations at an exact point.
Curated OER
Confidence Levels
Learners collect data and graph it. In this statistics lesson plan, students rate confidence levels by collecting data and analyzing it. They graph their findings on the Ti calculator.
Curated OER
Does Music Cam the Savage Beast?
Learners collect, graph and analyze data. In this statistics lesson, students measure the heart beat of a person as they listen to music. They use the CBL and TI to create a graph, analyzing the outcome.
Curated OER
Know the System
Students identify the different systems of equations. In this algebra lesson, students solve systems of equations using graphing, elimination and substitution. They use the Ti to graph their systems.
Curated OER
Parabolas
Students find equations of parabolas in real world scenarios. In this finding equations of parabolas in real world scenarios lesson, students find the equations of parabolas of US landmarks. Students put a grid on landmarks...


