Curated OER
Standard Form of Equations
Learners complete the square and identify different parts of a quadratic equation. In this algebra lesson, pupils graph conics using the TI calculator. They rewrite equations by completing the square.
Curated OER
Critical Points
Students identify critical points on a graph. In this calculus lesson plan, students graph their equations on the TI calculator. They zoom in and out to identify the critical points.
Texas Instruments
Graphical Derivatives
Pupils solve functions using the derivative. They determine the derivative of a function based on its graph, then analyze different functions and draw a relationship and conclusion based on the graph.
Curated OER
Taylor Polynomials
Pupils graph Taylor polynomials in this calculus instructional activity. They observe the graphs for the expansion of Taylor polynomial functions and use the Ti calculator to help create visuals of the graphs.
Curated OER
Exponential Transformations
Perform transformations on exponential functions! Teach your class how to perform dilation, compression, and translation. They graph exponential functions using the TI Calculator.
Curated OER
Logarithmic Transformations
Using the TI calculator to visualize and make predictions, students perform transformation vertically and horizontally on logarithmic graphs in order to solve problems.
Curated OER
A Steep Hike
Students explore slope. In this middle school mathematics instructional activity, students analyze and interpret graphs as they investigate slope as a rate of change. Students use a motion detector to collect data as they...
Curated OER
Wrapping It All Up
Through learning how to examine linear, quadratic, and exponential functions, young scholars explore the effects of changes in parameters on the graphs of linear, quadratic, and exponential functions. The lesson plan is designed to...
Curated OER
I'm Warm Now
Third graders graph how much water is wasted while waiting for it to get warm in the spigot in the sink. In this graphing lesson plan, student first predict how much water is wasted. That night they test it out at home and the next day...
Curated OER
Asymptotes and Zeros
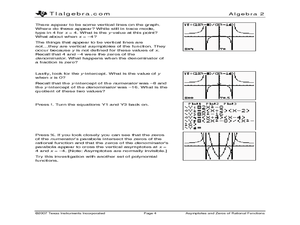
Learn how to explore rational functions and investigate the graphs rational functions and identify its singularities and asymptotes. Students approximate the solutions to rational equations and inequalities by graphing.
Curated OER
Transformations of Functions 1
Learn how to solve problems with transformation. High schoolers perform transformation on their graphs. Then, they use the TI to create a visual of the graph as it is moving along the graph.
Curated OER
Domain and Range 2
How do you identify the domain and range of the function? As learners find out it's as easy as creating a graph. They'll identify the domain and range of a relation from its graph, write symbolic expressions describing the relationship...
Curated OER
What's Up With the Weather?
Students examine raw data about temperatures throughout the world and record their observations. They work together to graph a specific year of data. They calculate an average temperature and discuss their findings.
Curated OER
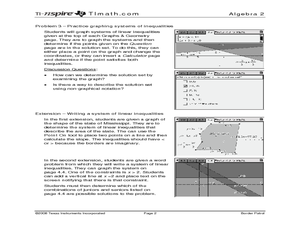
Border Patrol ID: 11603
Incorporate technology in your classroom by teaching your learners how to graph systems of linear inequalities as they apply to an area of land. The lesson plan provides an extension in which students are challenged to write a...
Curated OER
TI-Nspire Activity: What Does Your Representation Tell You?
By learning to select the best representation for three meal plans, students compare three meal plans to determine the best choice. Data for the meal plans is sorted on a table, as an algebraic equation, and graphed on a coordinate grid....
Curated OER
Lesson 3: Seven Day Road Trip
Students plan a seven day road trip. In this travel lesson, students plan a driving trip that includes five major cities or attractions in Florida or another state of their choice. They show the trip on a map, calculate distances that...
Texas Instruments
A Tale of Two Lines
Students graph systems of equation. In this calculus lesson, students graph their lines on a TI calculator. They identify the point of intersection and the type of solution.
Curated OER
Natural Logarithm
Young mathematicians solve problems of logs and natural logs. They graph functions of natural logs on the TI and relate integrals to natural logarithms.
Curated OER
Taylor Polynomial Examples
Young scholars graph Taylor polynomials. In this calculus lesson, students relate accuracy of a Taylor polynomial to the degree of the equation. They graph their polynomials using the TI calculator.
Texas Instruments
Convergence of Taylor Series
Students analyze taylor series for convergence. For this calculus lesson, students analyze the graph of a taylor series as it relates to functions. They use the TI calculator to graph and observe the different series.
Curated OER
Simple Inequalities on a Number Line
Students solve inequalities problems. In this algebra lesson, students graph the solution of inequalities on a number line. They discuss boundaries and open or closed intervals.
Curated OER
Multiplicity of Zeros of Functions
Pupils identify the multiplicity of exponents as they graph polynomials. They write equations for a function given the zeros of the function and work backwards from solving equations.
Curated OER
Building a Dream House
Tenth graders explore how to use basic geometry and calculation skills to design their dream house. They use calculation to design the home and estimate the price within a budget of $150,000.
Curated OER
Mapping the Ocean Floor
Students construct and interpret a line graph of ocean floor depth and a bar graph comparing the height/depth of several well-known natural and man-made objects and places. In addition, they calculate the depth of two points using sonar...


