Curated OER
Points on a Line
How do you find slope? You use points on a line of course. slope. Teach your class how to calculate and differentiate between horizontal and vertical lines. They are sure to be pros at graphing lines on a coordinate plane by the end of...
Curated OER
Standard Form of Quadratic Functions
Students factor quadratic equations. In this algebra lesson, students identify the factors and use them to graph the parabola. They find the parameters and vertex of each graph.
Curated OER
Determining Mean, Range, Median, Mode, and Probability
Students calculate mean, median, range, mode and probability. Then, working in teams, they use data from their workplace to compute values for these terms. Finally the class explores the term "probability" using a die.
Curated OER
Planning a Trip for Christopher Columbus
First graders plan a trip for Christopher Columbus. They use their math skills to construct a ship for Columbus' voyage. They show their ship and calculations to their classmates and build graphs to show the amount of supplies needed to...
Curated OER
Volume and Surface Area: Which Is More?
Learners explore the volume and surface area of three dimensional figures. Through the use of video, students discover three dimensional shapes, their uses in real-life applications, and methods used to calculate their volume and surface...
Curated OER
Percents: (An Application to Real Life Problems)
Seventh graders explore the concept of calculating percents. In this calculating percents lesson, 7th graders simulate ordering food off of a menu. Students work in groups to calculate the bill, tax, and the tip for the...
Curated OER
Conic Sections
Students explore the different properties of conics. In this algebra lesson, students calculate the midpoint of a line, the distances between two points as they get ready to find the focus and directrix in eclipse and other conics. They...
Curated OER
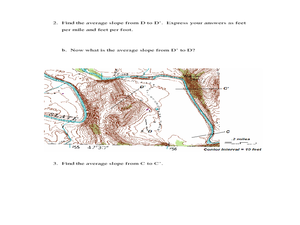
Slope and Topographic Maps
Learners investigate slopes as they study topographic maps. In this algebra lesson, students discuss and apply the concept of slopes to graphing and analyzing data.
Curated OER
Basic Limits
Learners calculate the limits of functions. In this calculus lesson, learners find the left and right handed limits of different functions. They use the Ti Navigator to drag the function around as they study limits.
Curated OER
Calculus Inverse Derivative
Students solve equations using a given derivative. In this calculus lesson plan, students identify the rise of fall of each function. They use the calculator to find the derivative.
Curated OER
Newton's Method
Student approximate the roots of E using Newtons Method. In this calculus lesson, students calculate the equation of tangent a line. They use the TI to visualize the tangent line.
Curated OER
Riemann Sums
Students calculate the area under a curve. In this calculus lesson, students use Riemann Sums to find the area under a curve. They apply the boundaries of intervals as they solve for each area.
Curated OER
Domain and Range
Your class will grasp the concept of domain-and range on a graph by using their TI navigator to graph their lines. They observe the effect of a function and non-functions based on the domain and range.
Curated OER
Graphic Designing with Transformed Functions
Teach your class how to transform a graph! By identifying the domain and range of the functions, students can observe the parabola and find the vertex of the transformed graph.
Curated OER
Finite Differences
Young mathematicians solve problems with polynomials. As they graph and analyze polynomial functions, learners define constant and finite, and determine the relationship between the constant set of differences and the slope of a linear...
Curated OER
Mean, Median, Mode and Range
Fourth graders investigate when to find the mean, median, mode and range. In this statistical concepts lesson, 4th graders collect data, make observations and graph the data. Students verify their work on the computer.
Curated OER
Surfing the Waves
Students use online resources, including animations,to define the slope of a curve and how to calculate the slope. They solve 8 problems online, using the definition of the derivative of a function at a point to calculate slope of the...
Curated OER
Wildlife Management
Students examine the effects of various management strategies on the size of wildlife populations. Each student simulates the management of an animal population in a card game, graphs the results of the wildlife game, and participate in...
Curated OER
Analyzing Equations Through Slope and Y intercepts
Students analyze equations using the slopes and intercept. In this algebra lesson, students graph equations give the slope and y intercepts. They are also asked to identify the slope and y intercept from a given graph. They solve real...
Curated OER
Analyzing Equations Through Slope and Y intercept
Students analyze equations using the slope and y-intercept. In this algebra activity, students identify the slope using a and the intercept using m. They graph linear equations based on the slope and intercept.
Curated OER
Using Tables to Solve Linear Functions
Oh that intercept! Budding algebra masters solve linear equations from standard to intercept form. They identify the slope and y-intercept to help graph the lines, an then create coordinate pairs using a table of values. Great TI tips...
Curated OER
Area Formulas
Teach your pupils to calculate the area of different polygons. Learners create formulas to solve their problems. They use the TI navigator to graph their shapes and observe the change in area.
Curated OER
Quadratic Functions and Stopping Distance
Learners solve quadratic equations. In this algebra lesson, students factor and graph quadratic functions. they use the properties of quadratics to calculate the distance.
Curated OER
The Demographics of Immigration: Using United States Census Data
High schoolers work together to analyze United States Census data on immigration. They compare and contrast the data and determine how immigration numbers have changed over time. They calculate percentages and make their own...


