Curated OER
Optimization
Learners identify the critical points to a function. For this calculus lesson, students perform optimization of functions. They use the TI to create a visual of the graph.
Texas Instruments
Integration By Parts
Pupils solve problems using integration by parts in this calculus instructional activity. Learners apply the product rule and integration by parts. They graph the equation and use the TI to observe the integration process.
Curated OER
Global Warming Statistics
Students research real-time and historic temperature data of U.S. and world locations, and analyze the data using mean, median, and mode averages. They graph the data and draw conclusions by analyzing the data. A spreadsheet is used to...
Curated OER
Interpreting Data and Building Hypothesis
Students define the term species, and graph species data together with previously collected data at the National Zoo. They interpret graphed data and recognize patterns in the streamside quadrant versus hillside quadrant. Students use...
Curated OER
Hit and Run
Pupils explore data collection in this lesson. They investigate distance vs. time and velocity vs. time graphs using information collected with a CBR 2 to simulate the reconstruction of an accident.
Curated OER
Mapping the Transcontinental Journey
Students develop their geography skills. In this Lewis and Clark lesson, students collaborate to calculate the time and distance of different segments of the expedition. Students compare their estimate to Lewis and Clark's.
Curated OER
Lines of Fit
Students analyze graphs. For this algebra lesson, students find the line of best fit, using scatter plots. They calculate the sale of popcorn as it relates to the price. They then analyze the graphs for positive, negative and no...
Curated OER
Slopes and Slope Intercepts
Students identify the slope of an equation using various methods. In this algebra lesson, students graph linear equations and calculate the slopes using the x and y intercept to solve the equations and graph the lines. They use the slope...
Curated OER
Slopes, Slope-Intercept Form, Standard Form
Students identify the slope of an equation using various methods. In this algebra lesson, students graph linear equations and calculate the slopes using the x and y intercept to solve the equations and graph the lines. They use the slope...
Curated OER
Technobiz
Students examine candy preferences to create a plan in order to improve candy sales. In this technobiz lesson, students build spreadsheet and organizational skills by graphing and calculating data. Students are introduced to terminology...
Curated OER
Where Will The Couch Fit?
Students name the area formula and describe how it works. They use area formula to calculate the surface area of various objects. They use the area formula to design a floor plan of an apartment.
Curated OER
Energy Eccentricity
Students assess their own energy use to help develop an awareness of the different types of natural resources affected by consumers. Their calculations show them how much they are personally impacting the Earth. Very meaningful and...
Curated OER
Pen Light Lab
Students study what makes Earth warm and explore how different locations on the planetreceive different amounts of solar energy based on the intensity of the sun's rays. They calculate light intensities and compare the
amounts of light...
Curated OER
How Far Did They Go?
Students create a map. In this direction and distance lesson, students come up with familiar places in the community and calculate the distances from these places to the school. Students create a map that displays these places and their...
Curated OER
Lobster Roll!
Students collect data by playing a game that illustrates the delicate ecological balance between fishing, fishing regulations and fish populations. They graph and analyze the data and explain how economic decisions can affect the...
Curated OER
Determining Area
High schoolers conduct chemical experiments. In this chemistry lesson, they investigate reactions using the CBL system. Learners will graph and analyze their data using a TI.
Curated OER
Lessons for Atlatl Users with Some Experience-Grade 6
Sixth graders experiment with an atlatl and dart. In this sixth grade data management mathematics lesson, 6th graders explore and determine the most suitable methods of displaying data collected from their experimentation with...
Curated OER
Square Foot Garden
Students plant a garden and keep track of it. In this geometrical garden instructional activity, students collect data from their garden twice a week. They graph their finding and figure out how many square feet of growing space...
Curated OER
Zeros of a Quadratic Function
Factor quadratic equations by teaching your students how to identify the zeros of the quadratic function. They use the TI to see where the graph will intercept the coordinate plane.
Curated OER
Alternate Interior Angles
Label angles of parallel lines to analyze the angles created by a transversal and two parallel lines. They graph their lines and observe the similarity and difference in the angles.
Curated OER
Triangle Sum Theorem
Teach your class how to solve problems using the triangle sum theorem. In this geometry lesson, students identify the missing angles in a triangle using the sum theorem. They graph triangles on the TI and moves the sides around to create...
Curated OER
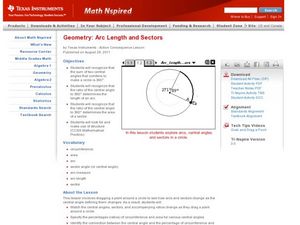
Arc Length and Sectors
Find the length of an arc. High schoolers relate central angles to the area and length of a sector and graph circles on the TI to make predictions.
Curated OER
Exploring Transformations: Translations and Reflections
Learners perform translation and reflection. They identify the coordinate points of the new graph and create a formula for the movement. They identify the pre-image the and after image.
Curated OER
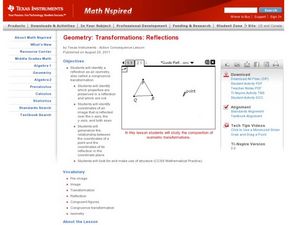
Transformations: Reflections
Students perform transformations on their graphs. In this algebra lesson, students identify the pre-image and image. They find and identify congruent shapes and isometry.


